


Technical Analysis
What Is a Trend Line in Technical Analysis?
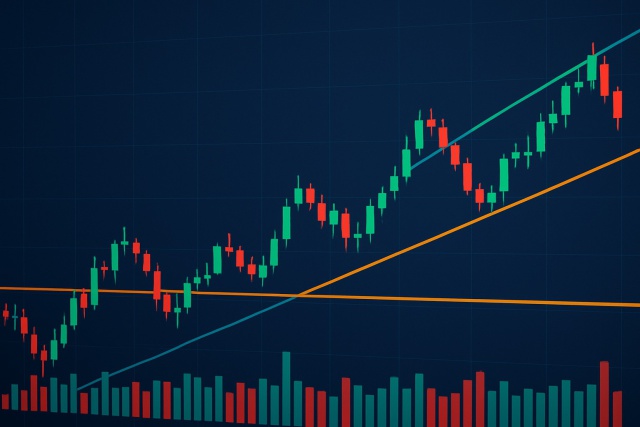
Trend lines are essential tools in technical analysis that help traders identify market direction an...
TradingView indicators are absolutely key in the world of technical analysis—they help traders untangle the sometimes messy market data and highlight potential opportunities that might otherwise slip under the radar. Layering several indicators together on TradingView usually improves trade accuracy and trims down those pesky false signals.
TradingView indicators use mathematical formulas to analyze price, volume or open interest data. They give traders some foresight on market trends and momentum. You’ll typically find them grouped into categories like momentum oscillators, trend-following tools, volatility measures and volume-based indicators.
Using indicators on TradingView offers many clear benefits. The platform’s intuitive interface makes it easy for traders to add and adjust indicators with just a few clicks. Its large library goes beyond the usual options and includes many community-created scripts to suit different trading styles. Real-time market data is built in to ensure signals remain fresh and timely for important entries and exits. Additionally, the social networking features allow traders to share strategies and scripts and create a lively hub for ongoing learning and growth.
No single indicator ever works perfectly on its own as I have come to realize. When traders mix and match several TradingView indicators they can double-check signals and slice through market noise like a hot knife through butter. This often helps them nail better timing for entries and exits.
Some TradingView indicator combos have really earned their stripes among traders mainly because they provide insights that just click when used together. Pairing trend-following tools with momentum oscillators or mixing volatility-based bands with shifts in momentum often helps traders spot signals that feel a lot more reliable.
MACD is a trusty trend-following momentum indicator that compares two moving averages, helping traders catch those subtle trend changes and momentum shifts before they become obvious. On the flip side, RSI steps in to gauge whether an asset might be tipping into overbought or oversold territory. When you combine MACD and RSI on TradingView, you get a nifty two-sided perspective. MACD highlights the underlying trend and momentum, while RSI checks if prices are stretched a little too far.
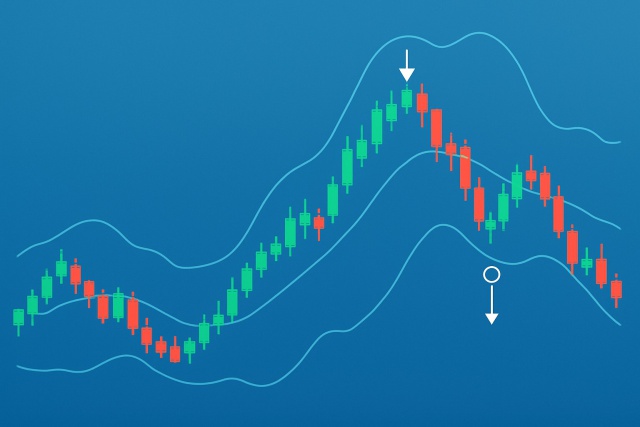
Bollinger Bands are a trader's trusty sidekick when sizing up market volatility and spotting price extremes by sketching bands around a moving average. When prices nudge or break through these bands it is often a hint that things might be stretching too far. Meanwhile the Stochastic Oscillator adds insight by flagging momentum shifts and lets you see when bullish or bearish strength is starting to lose steam. Putting both indicators together on TradingView charts can sharpen your sense of when a reversal is brewing.
The Ichimoku Cloud is quite the all-in-one tool offering a clear peek into trend direction, momentum and those key support and resistance levels. When you team it up with simple or exponential Moving Averages on TradingView, it usually does a great job of cutting through the noise—confirming the trend and filtering out pesky false signals.

Example TradingView chart illustrating popular indicator combinations in action
Picking the right mix of indicators really boils down to your personal trading style—whether you’re all about day trading, riding the swings or playing the long game. Each approach demands a different tempo of signals and a unique level of detail and sensitivity.
Be crystal clear about your trading goals whether you are after quick wins or gradually building up your assets over time.
Have some fun experimenting with different indicator combos on TradingView to find the ones that truly fit what you’re aiming for.
Keep an eye on how often signals appear because you want enough useful heads-ups without getting overwhelmed by noise.
Consider how complex the setups get. Usually, simpler is better since it avoids confusion and helps you make sharper decisions.
Don’t rush. Spend plenty of time getting comfortable with your setup on demo accounts. This is the best way to build confidence before risking real money.
To really nail the best results when juggling multiple TradingView indicators, make sure to set alerts for those key conditions so you don’t miss any important trade signals because let’s be honest no one likes to play catch-up. Try to avoid turning your chart into a cluttered mess with too many indicators since it only makes things harder to read and could leave you squinting at the screen. I’ve found it’s smart to tweak your indicator settings now and then to keep pace with the ever-changing market volatility and conditions.
Traders often fall into the trap of overcomplicating their charts by stacking indicators that tell the same story. This can leave them scratching their heads over mixed or confusing signals. Trying to fit a strategy too perfectly to past data usually sets the bar way too high—something I have seen trip up even seasoned pros. Ignoring the bigger picture like key economic events or overall market trends tends to make those indicator signals as unreliable as a weather forecast in April.
"Relying on a mile-long list of indicators can easily lead to analysis paralysis. From what I have seen, the traders who really make a mark tend to stick with just a handful of familiar tools—ones they know inside out. This way, they avoid getting bogged down by complexity and can make sharp, confident decisions instead." – A seasoned technical analyst
TradingView makes it straightforward to apply and backtest indicators within its platform. The built-in strategy tester lets traders try different indicator combos and see how they might have performed in the past, like a dress rehearsal before the real show.
Pick the asset and timeframe you want to dive into on TradingView—the playground for traders.
Toss in the technical indicators that vibe with your style from the indicators menu.
Tweak each indicator’s input settings like length and smoothing until they feel just right for your strategy.
Nail down clear entry and exit rules based on the signals your combo of indicators throws your way.
Fire up the strategy tester panel and punch in your entry and exit conditions.
Hit run on the backtest to eyeball performance metrics and scan the list of trades.
Scrutinize the results for profitability and drawdowns then tweak your settings like a trader who’s not afraid to fine-tune.

TradingView interface demonstrating how to set up indicators and use the strategy tester
TradingView’s Pine Script gives traders the power to craft their own custom indicator setups and automate alerts tailored exactly to their strategies.
Traders can whip up scripts that automatically generate buy or sell signals by programming logical conditions that blend together several indicator signals. Resources like TradingView’s Pine Script documentation and bustling community forums provide plenty of useful material to dive into. For example, you might mix MACD crossovers with RSI thresholds or craft systems based on volatility breakouts.
Combining TradingView indicators thoughtfully can help traders cut through market noise and confirm trends with more certainty. Whether you lean on favorites like MACD and RSI or get creative with custom setups using Pine Script, blending indicators carefully usually leads to clearer, more actionable analysis. Pair that approach with solid risk management and a good grasp of the market’s broader context. Suddenly these tools don’t just look good on paper—they genuinely boost your trading confidence and results.

Struggling to improve your trading performance? Edgewonk's advanced analytics tools are designed to give you the edge you need.
With detailed trade journaling, robust strategy analysis, and psychological insights, you'll gain a comprehensive understanding of your strengths and weaknesses. Don't miss out on this game-changing opportunity.

Driven by a passion for democratizing financial markets, Vivienne creates educational content on forex trading and currency market fundamentals for beginners.
Read PostsTrend lines are essential tools in technical analysis that help traders identify market direction an...

Discover the wedge falling pattern's secrets and learn step-by-step how to trade this powerful techn...
Master trading with Bollinger Bands by understanding volatility, setup patterns, and risk management...

Discover how to recognize the evening star candlestick pattern—a powerful signal highlighting potent...