


Technical Analysis
How to Trade a Wedge Falling Pattern
Discover the wedge falling pattern's secrets and learn step-by-step how to trade this powerful techn...
This guide takes a close look at TrendSpider’s advanced indicators, their advantages, and practical ways to weave them seamlessly into your trading routine.
TrendSpider indicators have steadily become indispensable tools in the evolving landscape of technical analysis by giving traders—whether green or seasoned—a smarter edge to decode market trends. By combining automation, artificial intelligence and highly customizable technical indicators, TrendSpider offers rare insights and handy signals you will not easily find elsewhere.
Technical analysis leans heavily on accurate and trustworthy indicators to make sense of price movements and forecast market trends.
TrendSpider indicators are nifty technical analysis tools designed to take some of the grunt work off your plate when spotting market trends and potential trading opportunities. Instead of sticking to old-school static indicators that barely budge, TrendSpider harnesses AI and dynamic charting to offer sharper real-time insights that often outpace what you would typically find on other platforms.
Automation and AI form the backbone of TrendSpider, quietly working behind the scenes to calculate indicators with precision and showcase them in real time. This clever setup takes a huge load off traders' shoulders, slicing through the tedious manual work while boosting the reliability of the signals.
TrendSpider seamlessly weaves its advanced indicators into dynamic charts and multi-timeframe views to offer traders a richer and more nuanced glimpse into market conditions. Alerts triggered by indicator signals keep users in the loop without missing a beat.
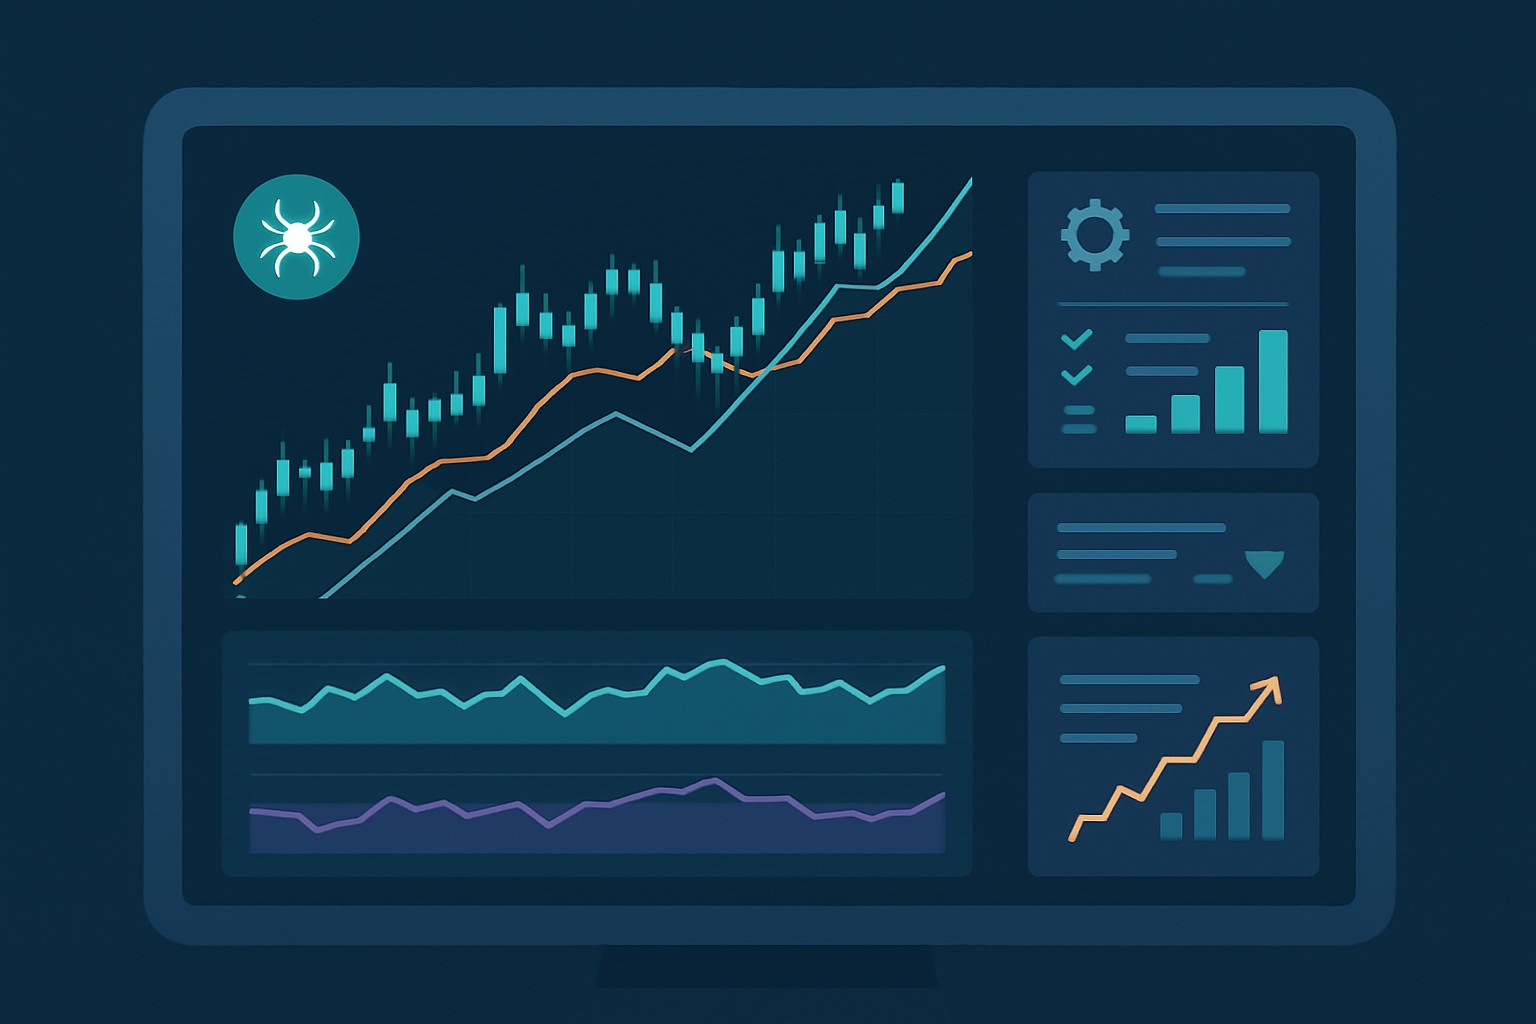
Dynamic TrendSpider chart illustrating automated trendlines, multi-timeframe RSI, and candlestick pattern recognition in action
A trader might lean on TrendSpider's automated trendlines paired with RSI alerts to jump into long positions when the price bounces off a trendline and flaunts some confirming bullish momentum. These combined indicators usually shine a light on smoother entry and exit points.
Both TrendSpider and TradingView bring solid technical analysis tools to the table but TrendSpider leans more heavily on automation and AI features that take the headache out of managing indicators and make things more precise. On the flip side, TradingView offers a massive library and vibrant community scripting options that give traders room to flex their creative muscles and collaborate with others. TrendSpider stands out by slashing manual setup time through automated trendlines, clever pattern recognition, and seamless syncing across multiple timeframes.
Here’s a rundown comparing TradingView and TrendSpider, zooming in on their technical analysis tools, pricing, and overall user experience to help you figure out which one feels like the perfect fit.
| Key Differences |  |  |
|---|---|---|
| Pricing | Pro: $14.95/mo, Pro+: $29.95/mo, Premium: $59.95/mo — not bad for dipping your toes in | Basic: $39.99/mo, Pro: $59.99/mo, Premium: $99.99/mo — pricier, but packed with features |
| Key Features | Advanced charting packed with tons of technical indicators and seamless access across devices | Automatic tech analysis, pattern recognition, and extra-sharp charting all bundled in |
| Automation & AI Capabilities | No automated analysis or AI pattern sniffing here — it’s more hands on | Leverages AI to spot patterns and auto-magically detect trends — savvy stuff |
| Customization & Flexibility | Lots of indicators and drawing tools, though custom coding options don’t run wild | Highly customizable indicators and charts — if you like to fiddle, this one's for you |
| User Accessibility & Device Support | Ready to roll on desktop, mobile, and tablets — wherever you happen to be | Web-based and works smoothly on desktop and mobile — no installs, no fuss |
| Community & Collaboration | Strong social vibes for swapping ideas and strategies — a real hub for chatter | Social features are on the light side; it’s more of a solo analyst’s playground |
| Ease of Use | Moderate learning curve, especially if trading is a brand new adventure for you | Tends to be a bit of a brain teaser at first, thanks to its advanced automated tools |
| Integration & Market Access | Plays nice with major brokerages for a smoother trading and data experience | Focused on charting and analysis without direct brokerage hookups |
| Visit TradingView Site | Visit TrendSpider Site |
Users often appreciate TrendSpider for how effortlessly it handles those tricky technical setups that can make your head spin, while TradingView shines thanks to its vast array of indicators and a treasure trove of community-created content that feels like a lively brainstorming session. Both platforms hold their own when it comes to alerting and charting.
Setting up TrendSpider indicators to align perfectly with your trading style is about picking the right tools and fine-tuning those settings just so. Mixing indicators together helps paint a fuller, clearer picture.
Fire up the chart you want and head to the indicators panel to explore TrendSpider's lineup of indicators.
Pick an indicator and tweak settings like length or sensitivity until it fits your strategy.
Stack a few indicators on the same chart to get confirmation from multiple angles.
Set up alerts in TrendSpider based on those indicator triggers so you will never miss a beat.
Save your custom indicator setups as presets to quickly pull them up on other charts or future sessions without breaking a sweat.
To nail down more reliable signals and reduce pesky false positives it’s worth playing around with different indicator settings. Try mixing up parameter combos, tweaking smoothing levels and bringing in volume or trend confirmations to help sift through the noise.
TrendSpider's automation does more than just lend a hand with visualization. Its indicators can be woven into automated strategies and backtesting routines, making life a bit easier for traders.
Using TrendSpider indicators as part of a disciplined trading system often helps traders keep their cool and cut through emotional noise while sharpening the accuracy of their entry and exit points—all vital ingredients for long-term success.
What You Get
Powerful charting options that help users spot market trends, patterns, and data with pinpoint accuracy — plus plenty of ways to tweak and customize to their heart’s content.
Lets traders quickly catch and make sense of complex market moves, giving their analysis a serious boost in precision.
Leverages artificial intelligence to automatically flag key chart patterns and potential trading signals right as they pop up.
Serves up timely, data-backed insights that cut down tedious manual work and shine a light on opportunities that might otherwise fly under the radar.
Lets users set up alerts tailored to specific technical rules and market conditions, delivering those notifications instantly through multiple channels.
Keeps traders sharp and ready to jump on important market moves, especially when things get a little wild.
Gives users the chance to test their trading strategies against historical market data so they can see how things would have played out before going live.
Cuts down risk by verifying how a strategy performed in the past, offering more confidence and a stronger footing for decision-making.
A clean, well-organized platform layout that makes technical analysis simpler to navigate — perfect even for those still finding their feet.
Eases the learning curve and speeds things along, letting users dive into analysis without getting tangled up in unnecessary complexity.
Grants access to a wide array of international markets and instruments, letting users analyze multiple exchanges and asset classes all in one place.
Empowers traders and investors to diversify their strategies and analysis beyond borders with ease.
A comprehensive set of automated tools combining charting, pattern detection, and alerts to smooth out the whole technical analysis grind.
Boosts productivity by handling routine tasks automatically and generating smart insights that help sharpen trading decisions.
TrendSpider indicators pack quite a punch but they’re not without their quirks. These include the temptation to lean on them too heavily, the occasional misread of signals, and the tricky business of dialing in settings as markets shift and dance.
"No single indicator ever works perfectly on its own; in my experience, effective trading really boils down to blending technical tools with solid risk management and having a clear grasp of the bigger market picture." — Experienced Technical Analyst
New users usually start by signing up for TrendSpider's platform and exploring the variety of indicators across different asset classes. The trial period is like a playground that lets them try key features such as automated trendlines, multi-timeframe oscillators and custom alerts. Tutorials, webinars and community resources can help grease the wheels of the learning process.
Many traders like to pair TradingView with TrendSpider, mainly because TradingView boasts a lively community and TrendSpider indicators offer really flexible scripts.

Struggling to improve your trading performance? Edgewonk's advanced analytics tools are designed to give you the edge you need.
With detailed trade journaling, robust strategy analysis, and psychological insights, you'll gain a comprehensive understanding of your strengths and weaknesses. Don't miss out on this game-changing opportunity.

Transforming the field of commodities trading through sustainable investing principles, she bridges traditional finance with ESG considerations.
Read PostsDiscover the wedge falling pattern's secrets and learn step-by-step how to trade this powerful techn...
Trend lines are essential tools in technical analysis that help traders identify market direction an...

Hidden bullish divergence is a key technical indicator revealing strong buying pressure beneath unce...

Master the momentum indicator to gauge price speed and trend strength. This ultimate guide covers ca...