


Technical Analysis
How to Trade a Wedge Falling Pattern
Discover the wedge falling pattern's secrets and learn step-by-step how to trade this powerful techn...
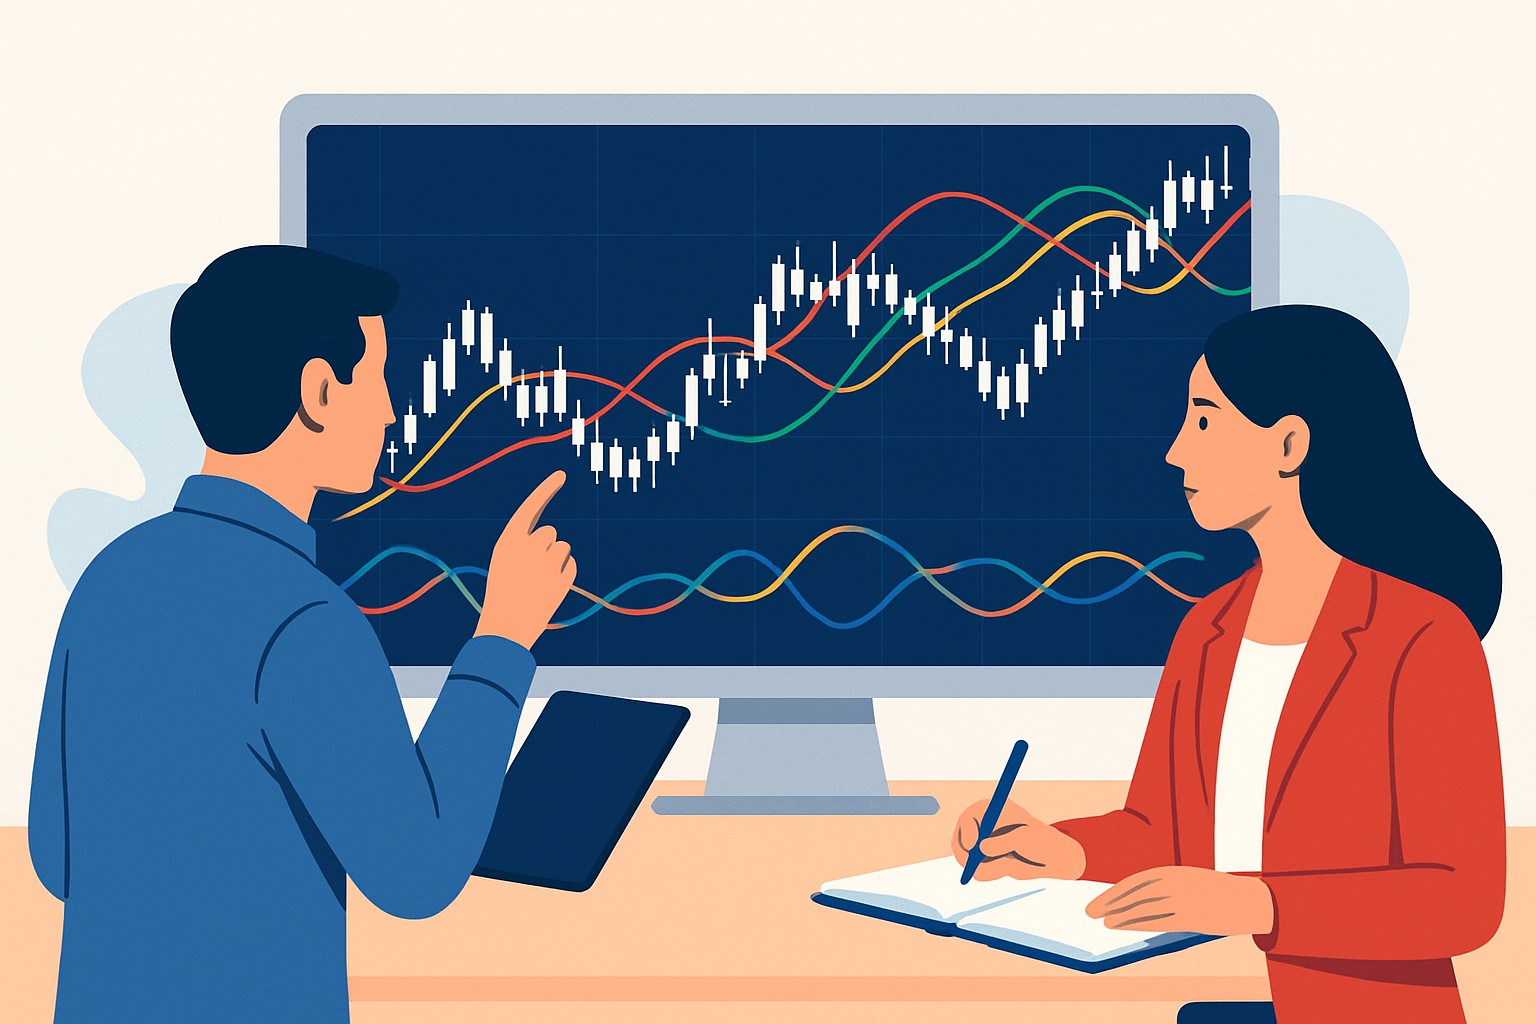
TradingView indicators are like your trusty sidekick for transforming complex market data into easy-to-read visual cues. Whether you’re a greenhorn just dipping your toes in or a seasoned pro with a few battle scars, getting the hang of how these indicators tick can help you catch trends and size up momentum to make smarter trading decisions.
TradingView indicators come in two flavors: built-in tools crafted by the platform or clever creations from users like yourself. They take the often overwhelming maze of historical and real-time market data displayed on charts and boil it down to something more digestible. Think of them as your market sidekick helping you spot trends without breaking a sweat, measure momentum when it’s picking up steam and monitor volatility so you are not caught off guard.
TradingView indicators lean on mathematical formulas to analyze data like past prices and trading volumes. They transform these raw numbers into visual aids such as lines, histograms and color-coded signals that make it easier to spot patterns and potential market trends over different timeframes.
TradingView indicators are a bit like the gauges on your car's dashboard—always keeping you in the loop. They provide real-time updates on what is going on, making it easier for traders to get a handle on market conditions and, hopefully, make smarter moves as they steer through their trades.
TradingView offers a wide array of popular indicators that traders often lean on for many types of analysis. Each one has its own role to play. Some help you read trend direction, others keep tabs on momentum and a few focus on swings in volatility or volume.
Moving Average (MA): Smooths out all the noisy price jitters to reveal the underlying direction of the trend.
Relative Strength Index (RSI): Keeps an eye on how quickly and strongly prices are moving, helping you get a feel for the market’s momentum.
Bollinger Bands: Paint a picture of volatility by drawing dynamic price channels that expand and contract.
MACD (Moving Average Convergence Divergence): Combines trend and momentum insights into one neat package, making it easier to spot when things might be shifting.
Volume Indicators: Show just how lively the trading action really is, often confirming whether a trend is the real deal or just a flash in the pan.
Stochastic Oscillator: Flags moments when the market might be getting a bit overbought or oversold.
| Indicator Name | Purpose | How it Works | Best Used For | Example Scenario |
|---|---|---|---|---|
| Moving Average (MA) | Determine trend direction | Calculates the average price over set periods to smooth out those pesky market jitters | Recognizing when things are trending up or down | Confirming that steady price climb or drop has some legs |
| Relative Strength Index | Gauge momentum | Compares average gains and losses over a timeframe, giving you a sense of who is got the upper hand | Timing entries or exits when strength shifts | Spotting those sneaky momentum reversals before the crowd catches on |
| Bollinger Bands | Evaluate volatility | Draws bands around a moving average based on standard deviations, basically wrapping price in a cozy envelope | Detecting price breakouts or when things are hunkered down tight | Pinpointing the calm before the storm with low volatility stretches |
| MACD | Indicate trend and momentum | Subtracts a longer moving average from a shorter one, creating signal line crossovers that hint at changes | Confirming trend reversals or when trends keep cruising | Trading those divergences that can catch you off guard if you’re not paying attention |
| Volume | Show market activity | Measures total shares or contracts traded – in other words, the market’s way of waving its hands | Validating price moves with strong crowd backing | Checking if a breakout is just talk or backed by real action |
| Stochastic Oscillator | Identify overbought or oversold conditions | Compares closing price to its recent price range, helping spot extremes that rarely last | Finding potential reversal zones | Detecting when a trend might be running out of steam and getting ready to call it a day |
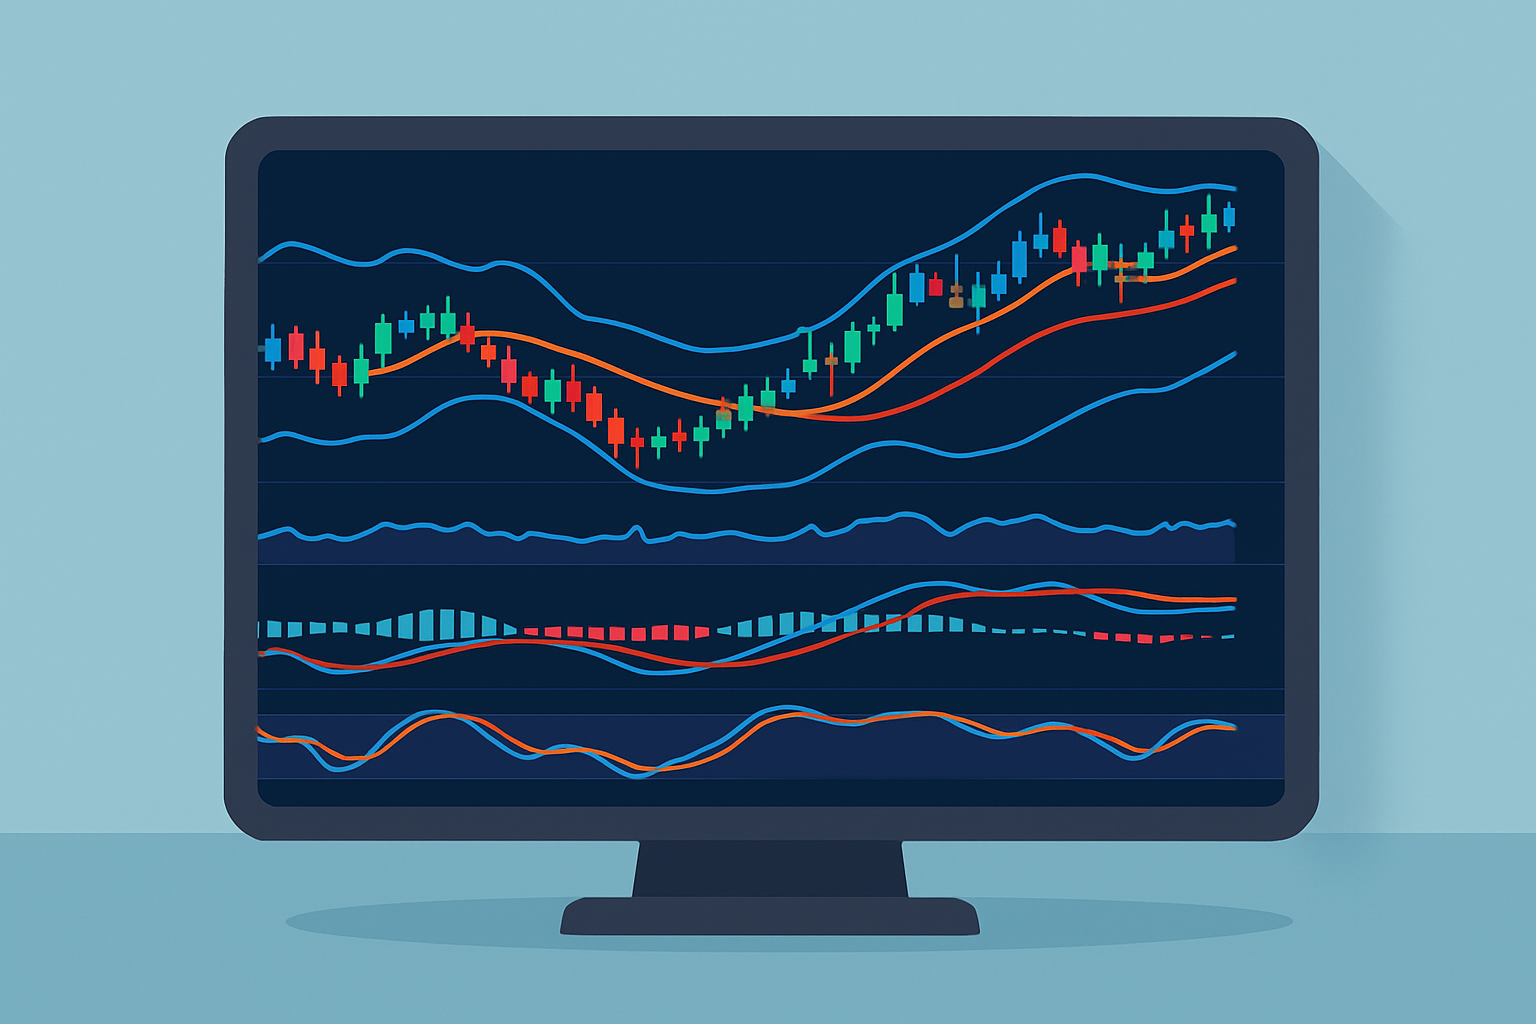
Example TradingView chart showcasing multiple popular indicators in action.
Adding and customizing indicators on TradingView is straightforward once you get the hang of it. Traders can choose from a broad array of indicators and fine-tune the settings to fit their unique strategy. They can even mix and match several indicators to sharpen their analysis.
Open up the TradingView chart and click the 'Indicators' button in the top toolbar—it’s easy to spot.
Take a moment to browse or quickly search for the indicator that interests you, whether it is one of the built-in options or something from the active community scripts.
After you find the one you want, click it and watch it appear on your chart.
Adjust the input settings like period length or smoothing methods to match your style because one size rarely fits all here.
Feel free to combine several indicators, as using more than one can provide a much clearer picture than relying on just one.
Remember to save your personalized indicator setup as a template so you can save a lot of time the next time you work with other charts.
TradingView indicators can be pretty handy, though I’ve noticed they’re often misunderstood. Lots of beginners assume these tools will somehow predict prices with absolute certainty or think that piling on more indicators guarantees a win. Indicators are just that—tools to help guide your decisions, not some magic wand.
Indicators work best as helpful guides, much like a weather forecast hinting at what’s likely to happen without guaranteeing the outcome. In my experience, successful trading usually comes down to blending what the indicators reveal with a healthy dose of experience and a knack for reading the market’s mood.
Really squeeze the most value out of TradingView indicators by choosing those that actually jive with your personal trading style. Don’t just stop there—try to find some confirmation by cross-checking signals across different tools. On top of that, regular backtesting and staying alert for any updates to those indicator settings can make interpreting signals much clearer and less of a guessing game.

Struggling to improve your trading performance? Edgewonk's advanced analytics tools are designed to give you the edge you need.
With detailed trade journaling, robust strategy analysis, and psychological insights, you'll gain a comprehensive understanding of your strengths and weaknesses. Don't miss out on this game-changing opportunity.

With 20 years experience in commodity trading, Jasper provides insights into energy markets, precious metals, and agricultural futures with a focus on macroeconomic trends.
Read PostsDiscover the wedge falling pattern's secrets and learn step-by-step how to trade this powerful techn...

Discover how to recognize the evening star candlestick pattern—a powerful signal highlighting potent...

Learn how the True Range indicator captures market volatility and price swings, empowering traders t...
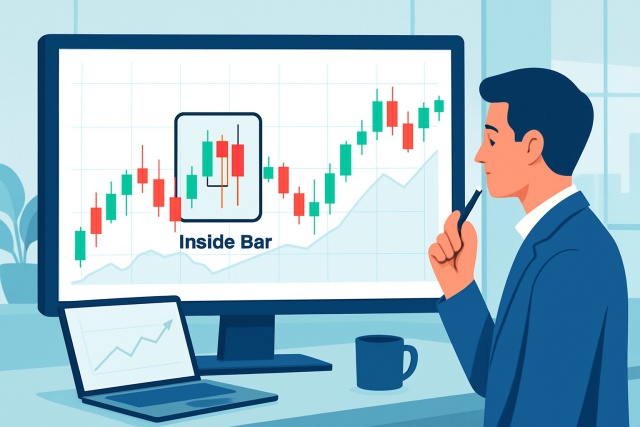
Discover how inside bar patterns signal key market pauses and possible breakouts or reversals. This...