

Technical Analysis
Inside Bar Pattern To Spot Breakouts And Reversals
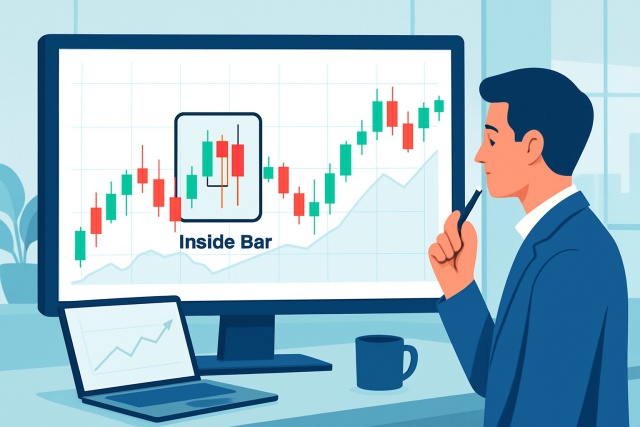
Discover how inside bar patterns signal key market pauses and possible breakouts or reversals. This...
The bullish pennant pattern is a handy chart formation that many traders swear by when trying to catch big upward price moves. We’ll walk you through the pattern step-by-step using simple language that anyone can grasp. You’ll discover how to spot this pattern, understand what’s really going on beneath the surface, and use it to time your trades more like a pro—whether you’re just dipping your toes into technical analysis or have some experience.
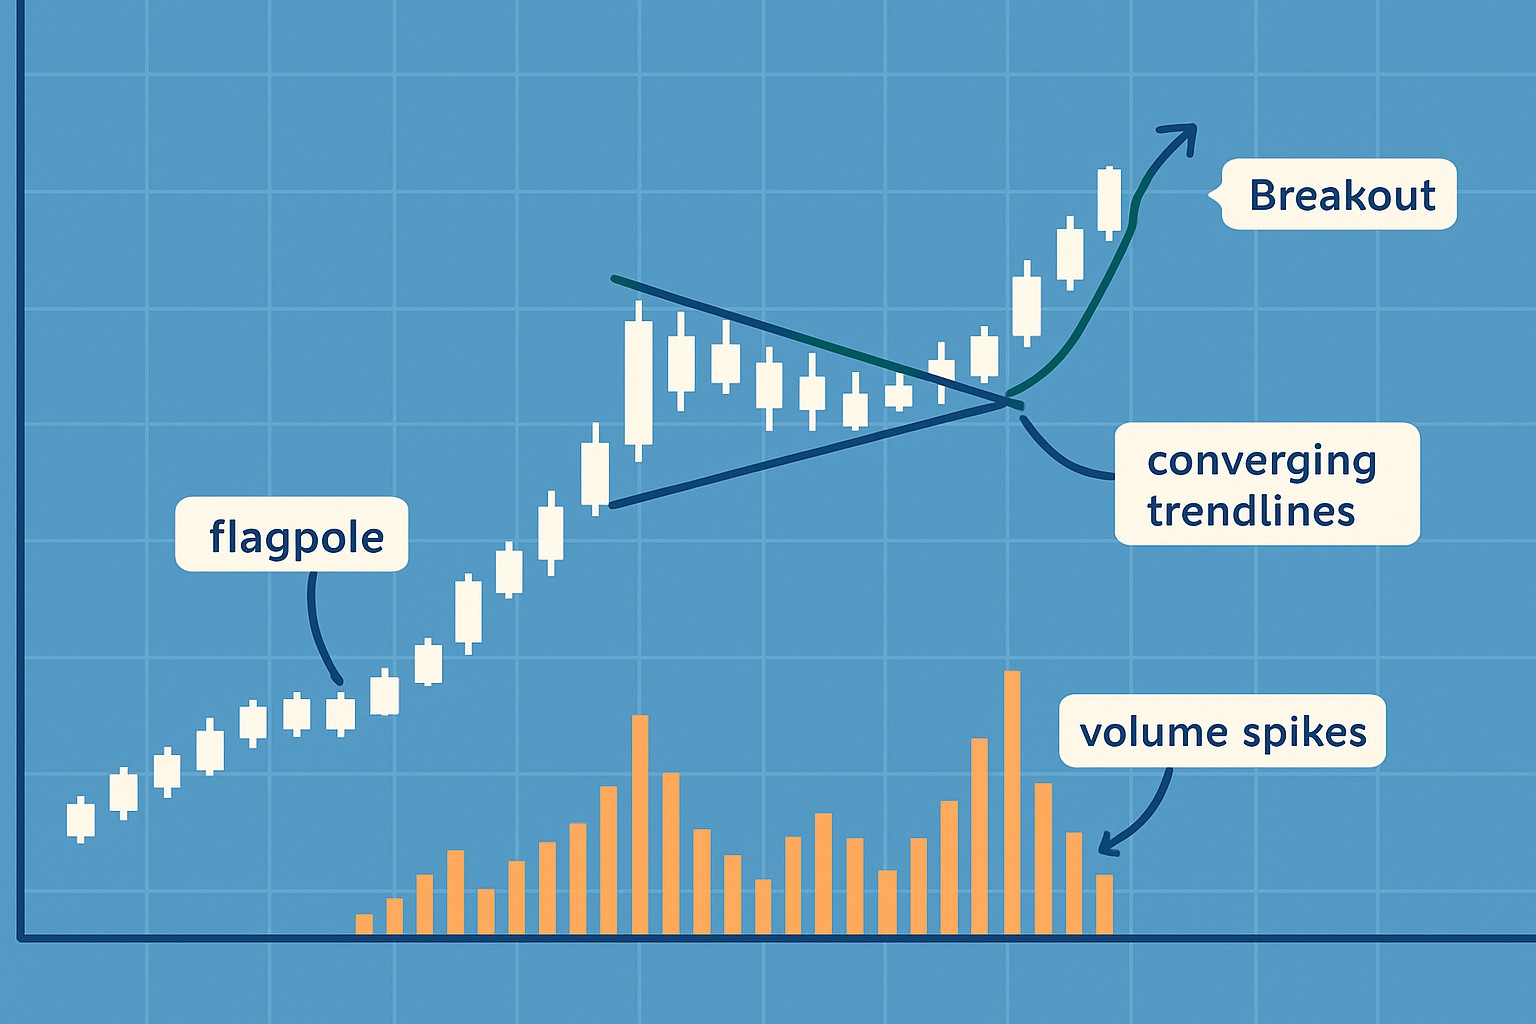
A bullish pennant pattern kind of looks like a small flag fluttering off a tall flagpole. It kicks off with a sharp price jump—what traders call the flagpole—then settles into a brief pause where prices drift sideways or squeeze tighter between two converging trendlines, which is the pennant itself.
Many traders often get their wires crossed between pennants, triangles and wedges since they all sport converging trendlines. Bullish pennants really steal the show because they pop up after a strong uptrend and flaunt a sharp, unmistakable flagpole before settling into a tight consolidation. Plus, bullish pennants usually hint at upward moves while bearish pennants tend to ring the alarm for downward trends.
Catchy name, right? Recognizing a bullish pennant pattern isn’t just for the pros—it’s a handy trick up your sleeve if you want to spot potential upward moves. Let’s break it down step-by-step, so you are not left scratching your head when it shows up on your charts.
Spot a bullish pennant pattern by keeping a keen eye on price movements and volume shifts—these details tell the story. First, look for the sharp price jump that creates the flagpole like the market gearing up for something big. Then watch as the price calms down and squeezes into a tighter range with trendlines converging and volume fading—like the calm before the storm. Finally the action kicks in when volume spikes and the price breaks out beyond the pennant.
Start spotting a strong, quick price jump that forms the flagpole—usually a string of bullish candles marching one after another. It’s like the market’s way of clearing its throat before the real show begins.
Keep an eye out for two trendlines that squeeze together during the consolidation phase, shaping a neat little symmetrical triangle called the pennant. Think of it as the market catching its breath.
Use volume indicators to check that activity is tapering off during this calm, hinting that fewer traders are involved—and that quiet moment often sets the stage for a big move.
Watch closely for the breakout above the pennant’s upper trendline, especially when volume suddenly spikes—it’s like the crowd cheering as momentum kicks in.
Plan your entry just after the breakout candle closes, so you can ride the wave upward without getting caught on the wrong side.

Example of a bullish pennant pattern on a price chart illustrating the flagpole, pennant formation, and breakout with volume.
The bullish pennant appears because it marks a short breather in a strong buying spree where traders catch their breath and supply and demand are neck and neck for a moment. This little pause tightens the market’s energy like a coiled spring. Then once buyers regain their confidence—usually faster than you would think—demand revs back up and pushes the price into a breakout.
The bullish pennant resembles a tightly coiled spring just waiting to snap. After a brisk upward surge, it squeezes in tight, holding its breath for a moment before unleashing its energy, shooting prices up fast in a powerful breakout.
When working with the bullish pennant in your trading game plan, it’s usually smartest to jump in only after the breakout has shown its true colors. Dropping stop-loss orders just below the pennant’s lowest dip tends to be a reliable way to keep your risk in check—nothing fancy, just solid risk management. For setting profit targets, think of it this way: take the length of the flagpole and add it right on top of the breakout price.
It is really vital to stick to solid risk management and keep an eye out for those sneaky false breakouts. I’ve found that waiting until the breakout candle actually closes before jumping in can save you from the heartache of rushing in too soon and wiping out your gains.
Take Tesla Inc. in 2020 as a classic example. It went through a sharp rally that formed a noticeable flagpole followed by several days of price consolidation squeezing tighter within narrowing trendlines and shaping a distinct pennant pattern. When the breakout finally hit, volume didn’t just tick up; it surged and ignited a solid run to the upside. Traders who jumped in right after the breakout often enjoyed impressive gains.

Tesla stock chart illustrating a bullish pennant with a sharp flagpole, symmetrical pennant, and breakout confirmed by volume.
| Asset Name | Flagpole Length (% Gain) | Pennant Duration (Days) | Breakout Volume Change (%) | Trade Outcome |
|---|---|---|---|---|
| Tesla (TSLA) | 18% | 5 | Volume jumped 35%, giving a strong nod to the move | Price climbed a solid 22% after the breakout, not too shabby |
| Bitcoin (BTC) | 15% | 7 | Volume bumped up 40%, showing some serious interest | Followed by a robust 25% rally that kept traders smiling |
| Apple (AAPL) | 12% | 4 | Volume increased 30%, quietly backing the trend | Advanced a steady 16% after breakout, doing its usual magic |
| Ethereum (ETH) | 20% | 6 | Volume surged 50%, like a shot of adrenaline | Expanded 30% in the days after breakout, keeping the momentum alive |
The bullish pennant pattern can definitely be a handy tool in your trading toolbox but it’s by no means foolproof. It often throws out false signals, especially when the market is stuck in a sideways shuffle without a clear direction or when the trading volume takes a noticeable dip. On top of that, significant news events tend to mess with the usual price dance that pennants typically signal.
The bullish pennant pattern signals become more trustworthy when traders team them up with other technical indicators—kind of like having backup dancers for the main act. Moving averages come in handy to confirm the current trend, while indicators like RSI give a peek into how strong the momentum really is. MACD crossovers often step in to double-check the technical muscle behind a breakout, and those volume spikes? They add that extra layer of proof that the move is the real deal.

Tired of missing opportunities and making suboptimal trading decisions? TrendSpider's cutting-edge platform automates complex technical analysis, saving you time and reducing human error.
With multi-timeframe analysis, dynamic alerts, backtesting, and customizable charting, you'll gain a competitive edge in identifying trends and making informed trades across global markets.

Known for demystifying options trading for retail investors, this former hedge fund manager brings Wall Street expertise to everyday trading education.
Read PostsDiscover how inside bar patterns signal key market pauses and possible breakouts or reversals. This...

Learn how the True Range indicator captures market volatility and price swings, empowering traders t...
Master trading with Bollinger Bands by understanding volatility, setup patterns, and risk management...

Hidden bullish divergence is a key technical indicator revealing strong buying pressure beneath unce...