


Technical Analysis
What Is a Trend Line in Technical Analysis?
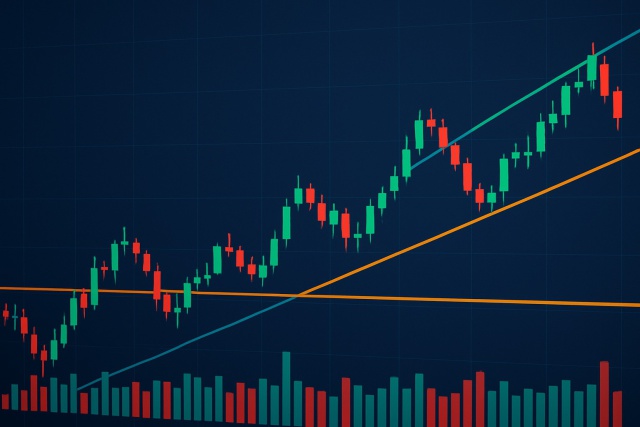
Trend lines are essential tools in technical analysis that help traders identify market direction an...
Heikin-Ashi candlesticks give traders a fresh angle on price action by smoothing out noisy market jitters and highlighting the bigger picture trend. Unlike typical candlesticks that lay out the raw open, high, low and close prices for a given period, Heikin-Ashi tweaks those numbers a bit. Think of it as a gentle filter that dials down sudden jumpy moves. It often makes spotting clear trends and potential reversal points easier. This can be a real lifesaver when you are trying to make well-informed decisions.
Heikin-Ashi literally means "average bar" in Japanese and is a clever candlestick charting method built to slice through the usual market noise and highlight smoother, more digestible trends.
Heikin-Ashi candles are crafted using formulas that gently smooth the twists and turns of price direction and strength. Rather than relying on raw market prices, each candle's open, close, high and low are calculated by blending current and past data. This approach does a great job of taming sudden erratic swings that can make charts feel like a rollercoaster ride.
| Component | Traditional Candlestick Calculation | Heikin-Ashi Candlestick Calculation |
|---|---|---|
| Open | Simply the close price of the previous candle, nothing fancy there | A little twist here: the average of the previous Heikin-Ashi candle’s open and close, calculated as (O_prev + C_prev) / 2 — smoothing things out nicely |
| Close | The last traded price during the current period, plain and straightforward | The average of the current period's open, close, high, and low prices: (O + H + L + C) / 4 — pretty much like taking a snapshot of everything happening right now |
| High | The highest price that made an appearance during the period | The top value among the current period's high, Heikin-Ashi open, or close — making sure we don’t miss the peak |
| Low | The lowest price that showed up during the period | The bottom value among the current period's low, Heikin-Ashi open, or close — keeping an eye on the floor |
Where O=Open, H=High, L=Low, C=Close. Because acronyms are friends, not foes.
Heikin-Ashi candles don’t show the exact transaction prices at close. Instead they offer a gentler averaged and smoothed view of the data. This little twist can throw beginners for a loop.
Getting a handle on Heikin-Ashi candlestick patterns can feel a bit like learning a secret handshake in the trading world. These patterns smooth out the usual noise you get from standard candlesticks and, in my experience, they offer a clearer picture of market trends. If you have ever been frustrated by all the zigzags and false alarms on your charts, Heikin-Ashi might just be the calming balm you did not know you needed. Let us dive in and unravel what makes these patterns tick, making your trading decisions a bit more straightforward and maybe even a little less stressful.
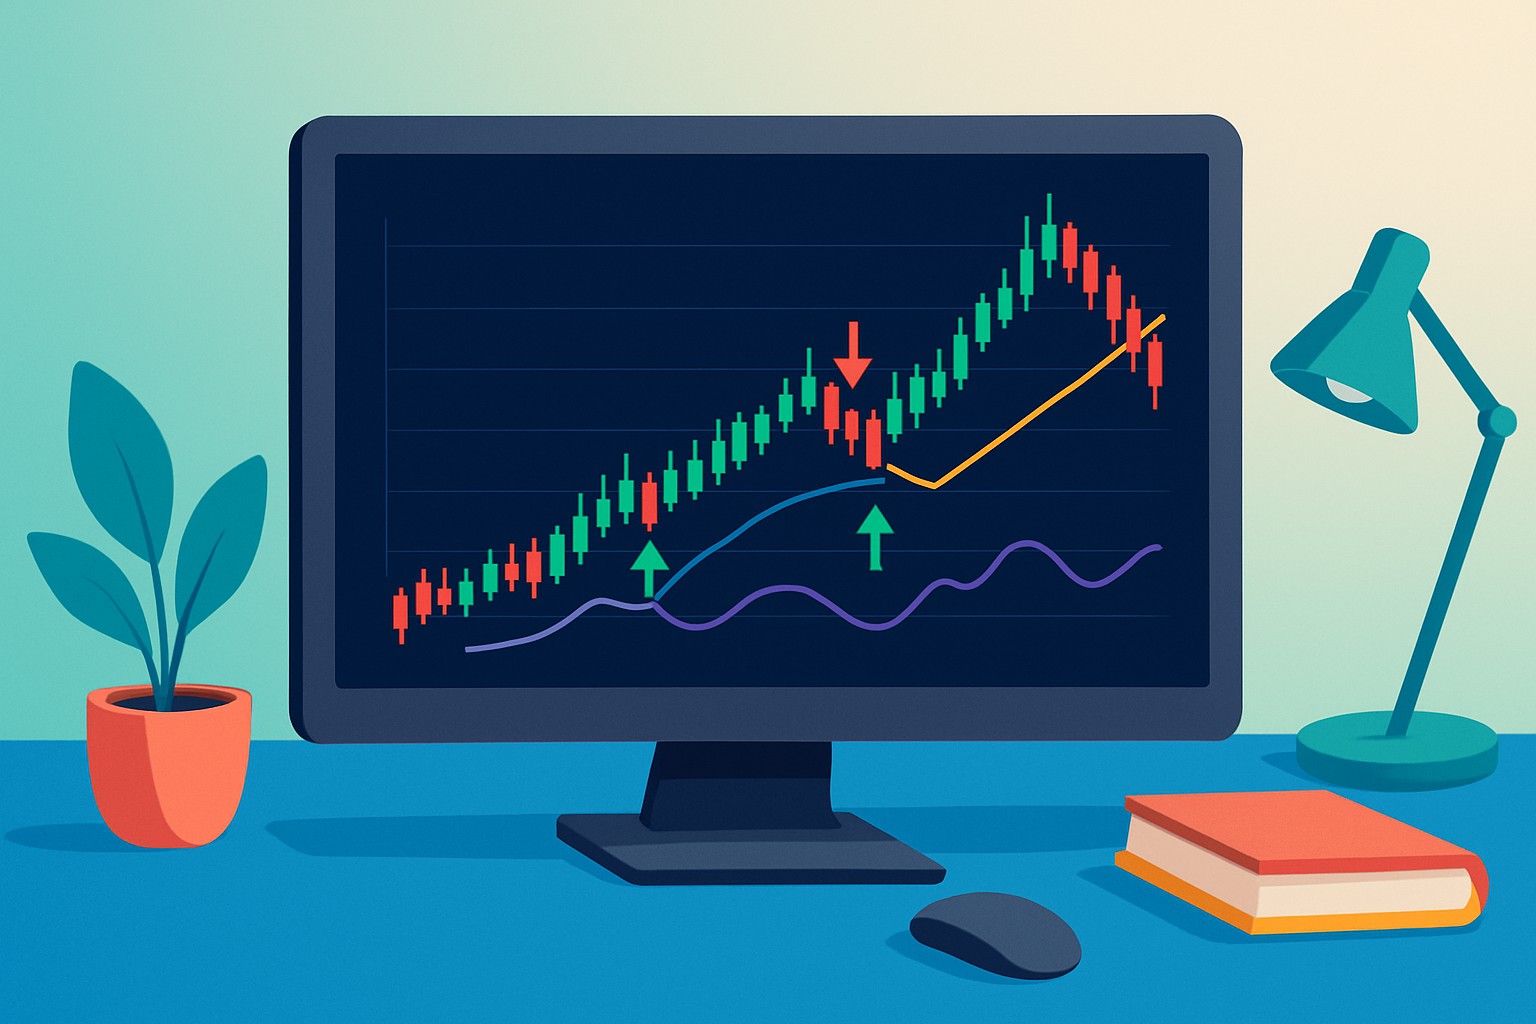
Heikin-Ashi charts simplify spotting market momentum by showing how candle shapes and colors change over time. When traders spot certain candle patterns they get a clearer idea of whether trends are charging ahead bullish or pulling back bearish, taking a breather or just feeling uncertain.
Heikin-Ashi candlestick chart illustrating various trend patterns and market conditions clearly.
Traders often turn to Heikin-Ashi charts as a handy tool to time their entries and exits, keeping an eye on changes in candle color and shape that hint at shifts in momentum. Watching for confirmation across several candles is a smart move to cut down on those pesky false signals.
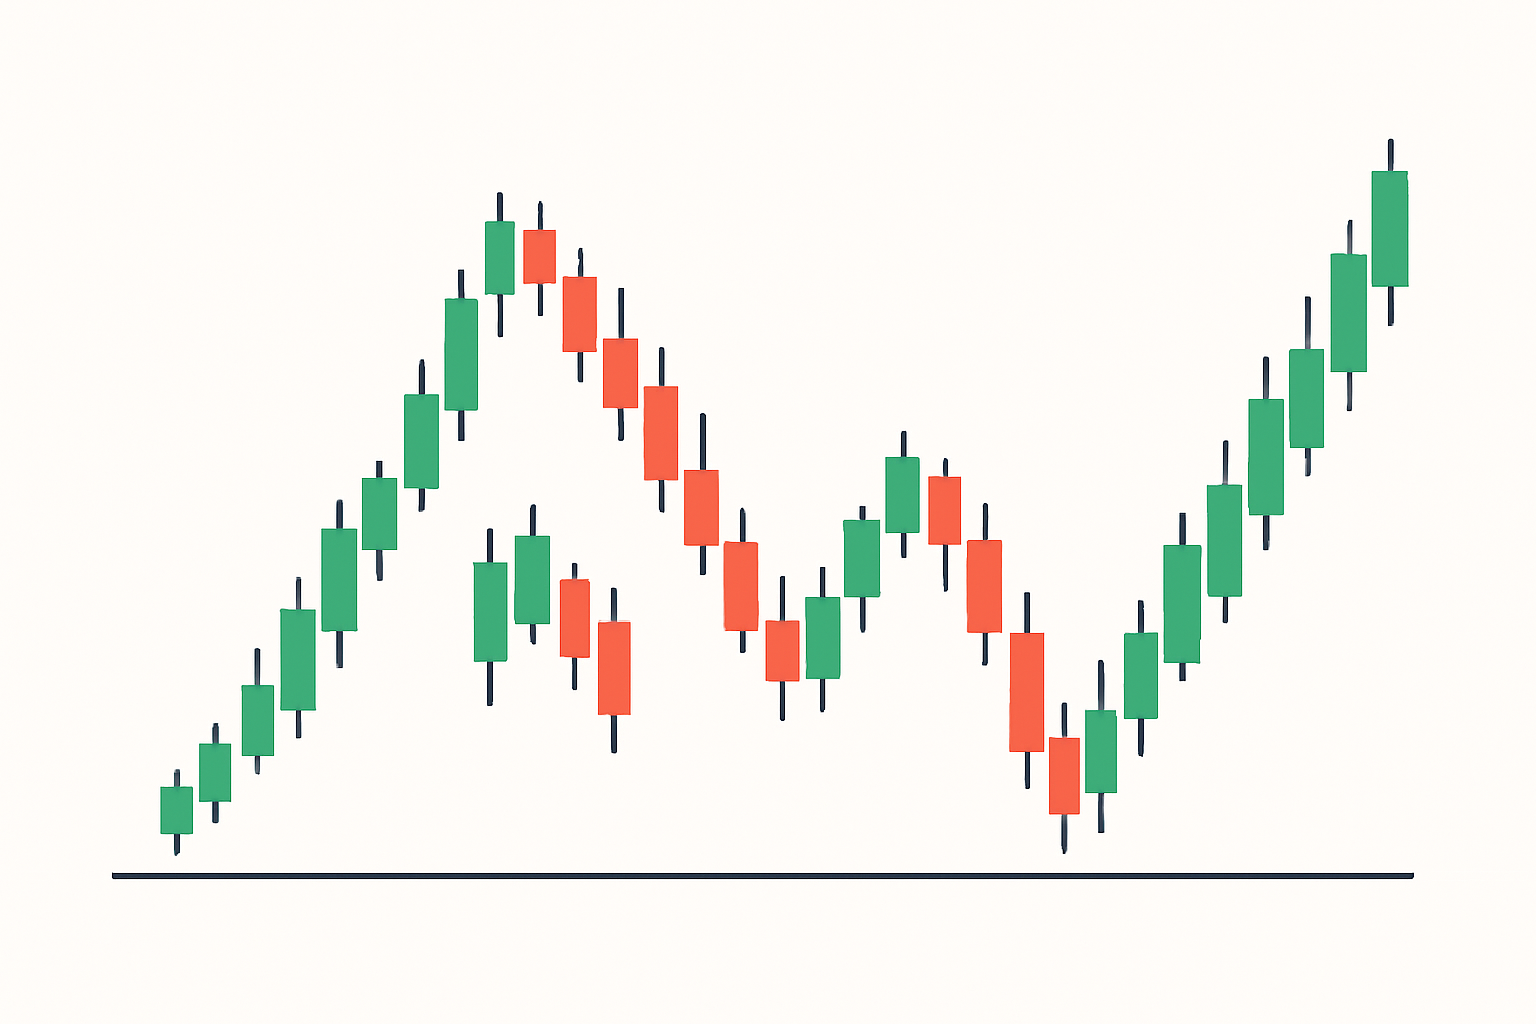
Keep an eye out for a clear trending market by spotting a string of Heikin-Ashi candles all dressed in the same color and sporting minimal shadows.
Make sure the trend is locked in by checking several Heikin-Ashi candles in a row to confirm the move is steady and not just a fleeting blip.
When you see the candle color flip from green to red or the other way around, that’s often your gentle nudge to consider jumping into a trade that rides the new wave.
Those candles with small bodies flanked by longer shadows can be sneaky little hints that it’s time to think about exiting or tightening your stops.
I’ve found it’s best to pair Heikin-Ashi signals with other trusty indicators like volume or RSI to give your trade entries an extra layer of confidence and filter out those pesky false alarms.
Heikin-Ashi can definitely make spotting trends simpler though leaning on it solely has its own headaches. Because the candles use averaged data their signals tend to lag behind the action and might leave you a step slow when entering or exiting trades. On top of that Heikin-Ashi doesn’t show volume or momentum strength by itself so it’s smarter to mix it with other tools like MACD or Relative Strength Index (RSI) or volume analysis. These extras help traders get a better read on the muscle behind price moves and avoid jumping the gun on false reversals.
Heikin-Ashi candlesticks have a knack for cutting through the usual noise with traditional candles and making trends stand out clearer. It’s like having a cleaner lens to track momentum and spot sneaky reversals before they catch you off guard. This smoothing of data means the signals tend to lag a bit and the exact price points aren’t as crisp, which can throw off the timing for entries and exits if you’re not careful.
Traders often lean on Heikin-Ashi alongside trusty indicators like RSI and MACD as well as volume analysis and support and resistance levels. These tools team up to paint a clearer picture. Heikin-Ashi shines a light on the trend direction while the others gauge strength, momentum and reversal points.
When a trader spots a string of green Heikin-Ashi uptrend candles, they’ll often glance over at the RSI to see if the momentum is really backing those gains or just showing off. Next, they check whether the price is pushing through a key resistance level—because breaking through that kind of barrier can be a real game changer. Seeing a rising MACD crossover on the same chart usually adds a nice boost of confidence before pulling the trigger on a trade.
For traders just dipping their toes into Heikin-Ashi candlesticks, it is wise to take things step by step and resist the urge to jump into quick trades based solely on these candles. Getting comfortable with them takes some practice.

Are you tired of juggling multiple tools for your trading needs? TradingView is the all-in-one platform that streamlines your analysis and decision-making.
With its powerful charting capabilities, real-time data, and vibrant community, TradingView empowers traders like you to stay ahead of the market. Join thousands who trust TradingView for their trading success.

Transforming the field of forex trading through his systematic approach to currency pair analysis, he focuses on macroeconomic indicators and central bank policy impacts.
Read PostsTrend lines are essential tools in technical analysis that help traders identify market direction an...

Learn how the True Range indicator captures market volatility and price swings, empowering traders t...

Discover how to recognize the evening star candlestick pattern—a powerful signal highlighting potent...

Hidden bullish divergence is a key technical indicator revealing strong buying pressure beneath unce...