


Technical Analysis
Recognizing an Evening Star Candlestick Pattern in Charts
Discover how to recognize the evening star candlestick pattern—a powerful signal highlighting potent...
The bearish hammer is a specific candlestick pattern that often pops up in technical analysis, especially when traders look for potential market reversals. Despite the intimidating name, understanding what the bearish hammer means and how to spot it can offer traders and investors useful insights. We break down the bearish hammer in simple terms, explore how it forms and why it’s important.
A bearish hammer is a candlestick pattern that often signals a potential show of weakness or a bearish reversal after an uptrend. Unlike its more familiar cousin the bullish hammer, the bearish hammer has distinct traits that hint at growing selling pressure despite some early buying enthusiasm.
Spotting a bearish hammer is all about knowing what to look for with your eyes and just as importantly where it appears on the chart. This section gently guides beginners through recognizing this pattern using everyday charting tools or trading platforms.
Make sure the market has been clearly trending upward since the bearish hammer usually shows up right after a nice run of bullish movement. It is like a plot twist in a story you didn’t expect.
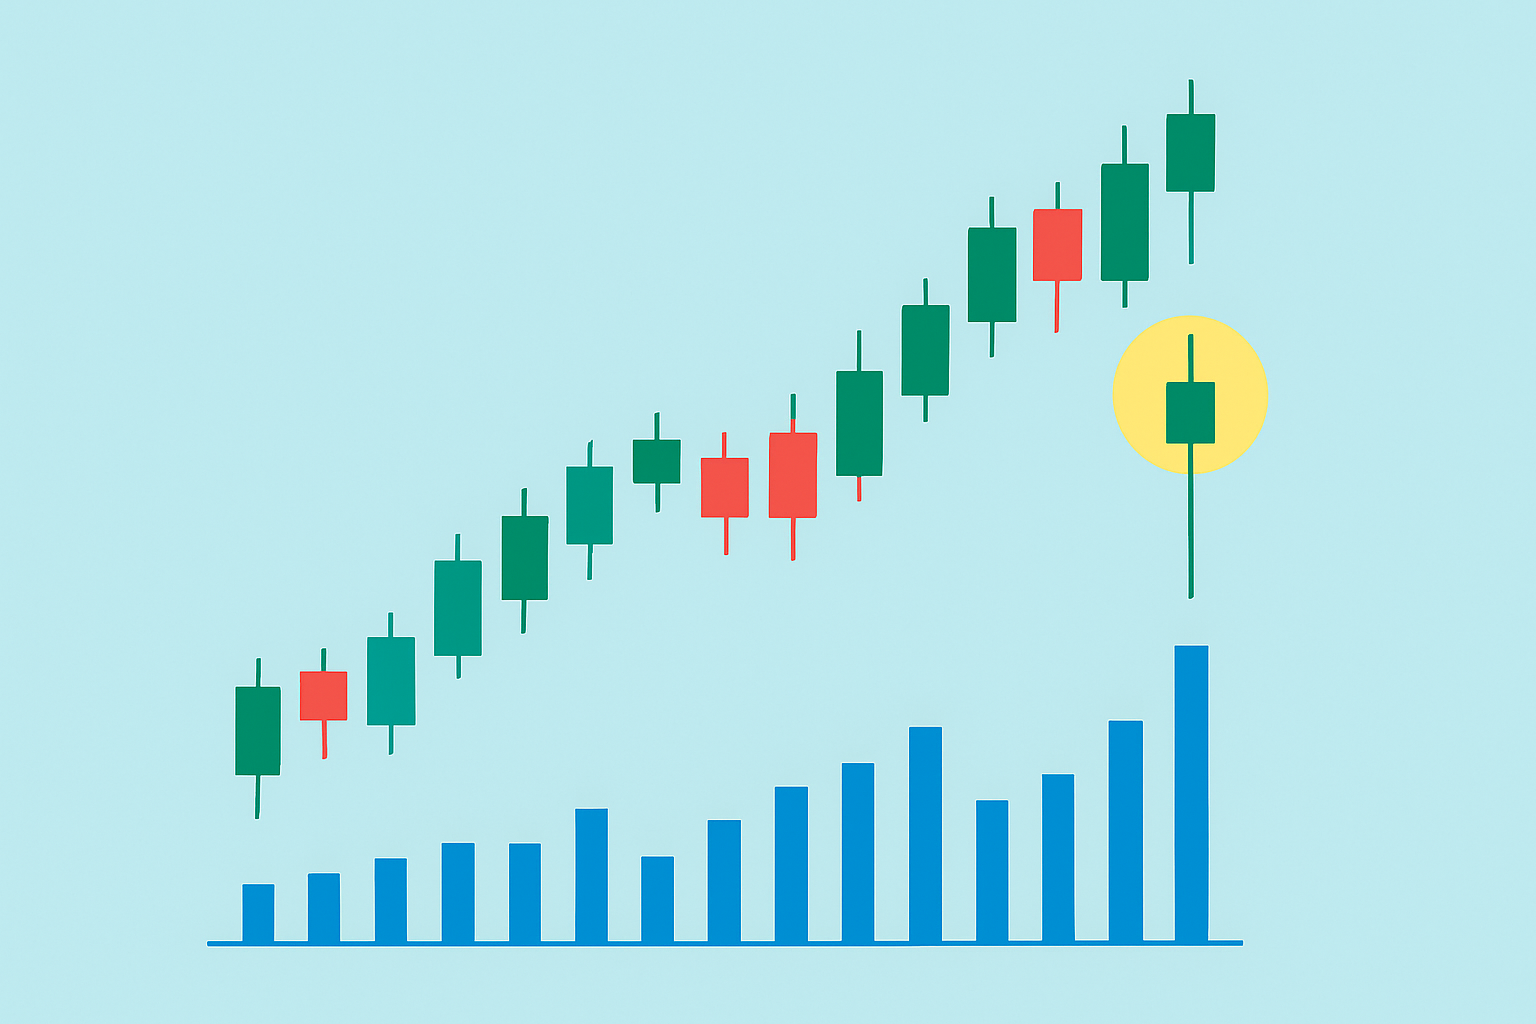
Take a close look at the candlestick’s shape. The real body should be small and hanging out near the top of the candle, almost like it’s clinging on for dear life.
Check that the lower shadow is long, typically at least twice the length of the real body. This indicates strong selling pressure during that period, as if the bears briefly crashed the party.
Confirm the upper shadow is very short or missing altogether. This tells you buyers just couldn’t push prices any higher no matter how hard they tried.
Keep an eye out for higher trading volume during the bearish hammer or shortly afterward because this can add some serious muscle to the pattern’s significance.
Look for a bit of confirmation from the very next candle, which ideally closes below the real body of the bearish hammer. This really seals the deal on a possible reversal.
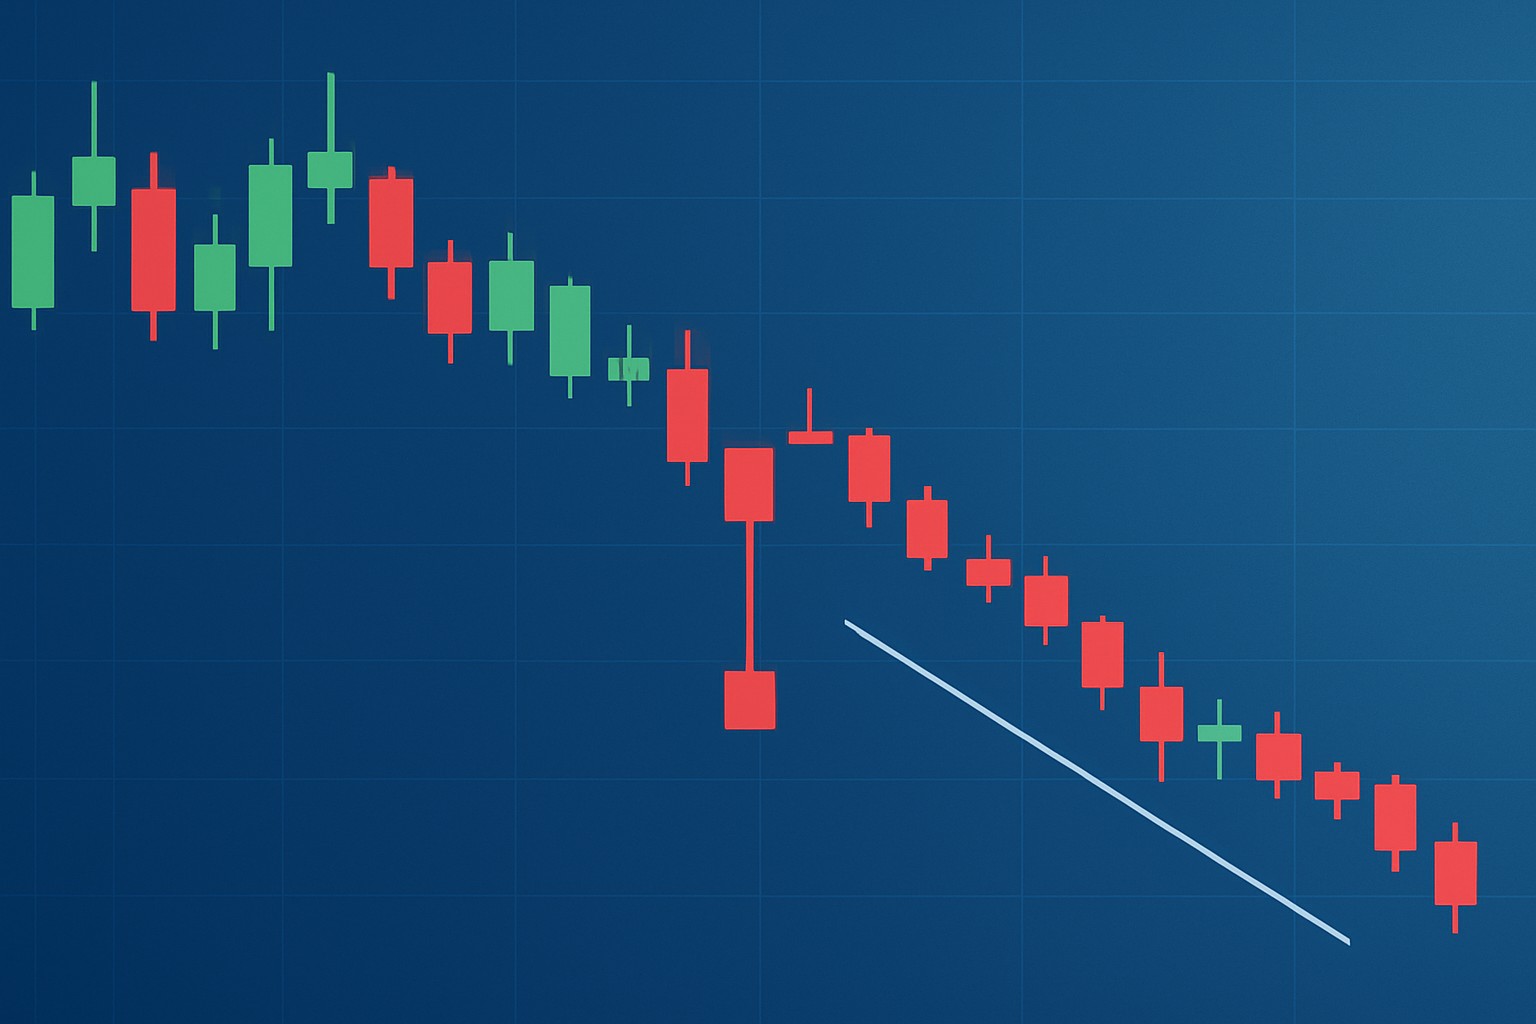
Example of a bearish hammer candlestick pattern forming after an uptrend on a price chart
The bearish hammer shows a real tug-of-war between buyers and sellers. Initially buyers seem to have the upper hand by pushing prices higher but soon sellers come back with a vengeance and drag prices down close to or even below where they started the day.
The bearish hammer often shows up as a final, somewhat desperate push by buyers trying to lift the price, but once that shadow falls, it’s a pretty clear sign sellers are ready to take the reins again—hinting that the market’s mood is about to shift.
Bearish hammers often get tangled up with other candlestick patterns like bullish hammers or shooting stars. Each one tends to tell its own story depending on where it shows up in a trend and what it looks like.
| Pattern Name | Visual Characteristics | Typical Location in Trend | Psychological Implication | Trading Signal |
|---|---|---|---|---|
| Bearish Hammer | Small real body perched near the top, with a long lower shadow and barely any upper shadow to speak of | Usually pops up after an uptrend | Sellers are flexing their muscles, overcoming the last hurrah of buyers | Could signal a bearish reversal |
| Bullish Hammer | Tiny body sitting low near the bottom, sporting a long lower shadow and just a hint (or none) of an upper shadow | Commonly shows up after a downtrend | Buyers are stepping up, trying to wrest control away from sellers | Might indicate a bullish reversal |
| Shooting Star | Small body tucked near the bottom, topped with a long upper shadow and little to no lower shadow | Typically appears after an uptrend | Buyers gave it their all pushing prices up, but couldn’t hold onto it | Often points to a possible bearish reversal |
| Inverted Hammer | Small body hanging out near the bottom, with a pronounced long upper shadow and hardly any lower shadow | Usually shows up after a downtrend | Buyers seem eager, attempting to flip the script on the bears | Could be a sign of bullish reversal |
Once you spot a bearish hammer, traders usually wait for a bit of confirmation and keep risk management front and center before pulling the trigger.
Wait for the confirming candle to close below the bearish hammer’s real body—this little patience can really help cut down on false alarms that often sneak in.
Place a stop-loss just above the high of the bearish hammer candle. It acts as your safety net in case the reversal decides to play hard to get.
Keep an eye out for spikes in trading volume alongside the bearish hammer, since these often add some serious weight to the pattern’s credibility.
Look for bearish hammer signals together with indicators like RSI (to spot those overbought conditions) or MACD (for bearish crossovers). It’s like having a tag team backing your call and boosting your confidence.
Use support and resistance levels to pinpoint good entry points and set realistic price targets—because every savvy trader knows location matters.
Adjust your trade size based on your risk tolerance and how solid the confirmation looks. Managing risk isn’t just smart, it’s essential if you want to keep playing the game.
Many traders tend to misread bearish hammers or lean on them a bit too heavily without backing them up with extra confirmation, and that’s often a recipe for costly mistakes.
Using technical indicators alongside bearish hammer patterns tends to boost the reliability of trading signals quite a bit. Tools such as RSI and MACD or moving averages provide valuable clues about momentum, market strength and important support or resistance levels.

Are you tired of juggling multiple tools for your trading needs? TradingView is the all-in-one platform that streamlines your analysis and decision-making.
With its powerful charting capabilities, real-time data, and vibrant community, TradingView empowers traders like you to stay ahead of the market. Join thousands who trust TradingView for their trading success.

Transforming the field of commodities trading through sustainable investing principles, she bridges traditional finance with ESG considerations.
Read PostsDiscover how to recognize the evening star candlestick pattern—a powerful signal highlighting potent...

Hidden bullish divergence is a key technical indicator revealing strong buying pressure beneath unce...
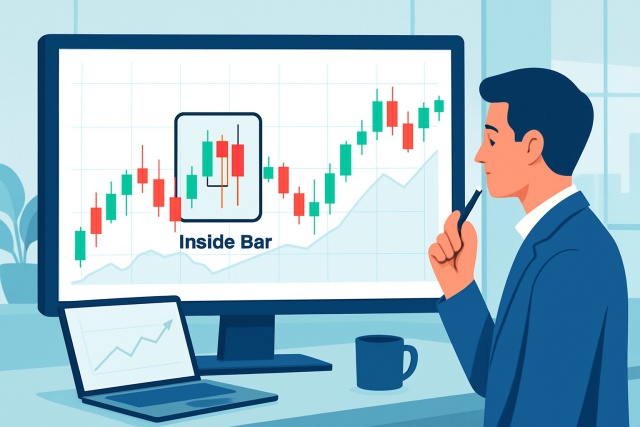
Discover how inside bar patterns signal key market pauses and possible breakouts or reversals. This...

Discover the wedge falling pattern's secrets and learn step-by-step how to trade this powerful techn...