
Transforming the field of commodities trading through sustainable investing principles, she bridges traditional finance with ESG considerations.
Read Posts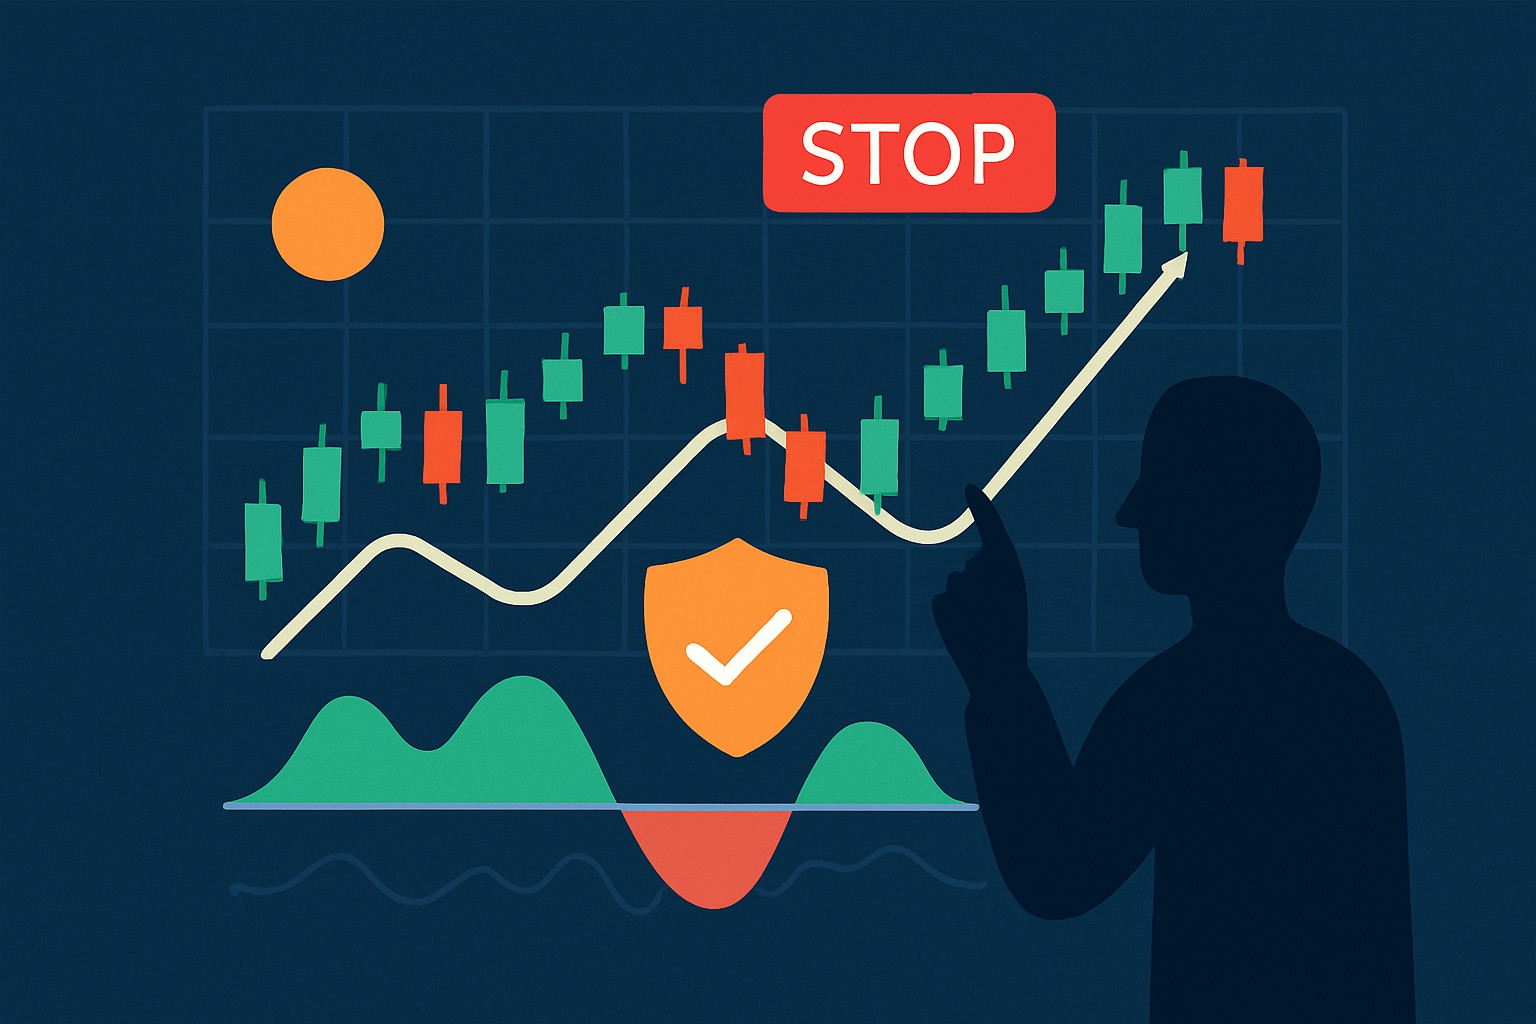
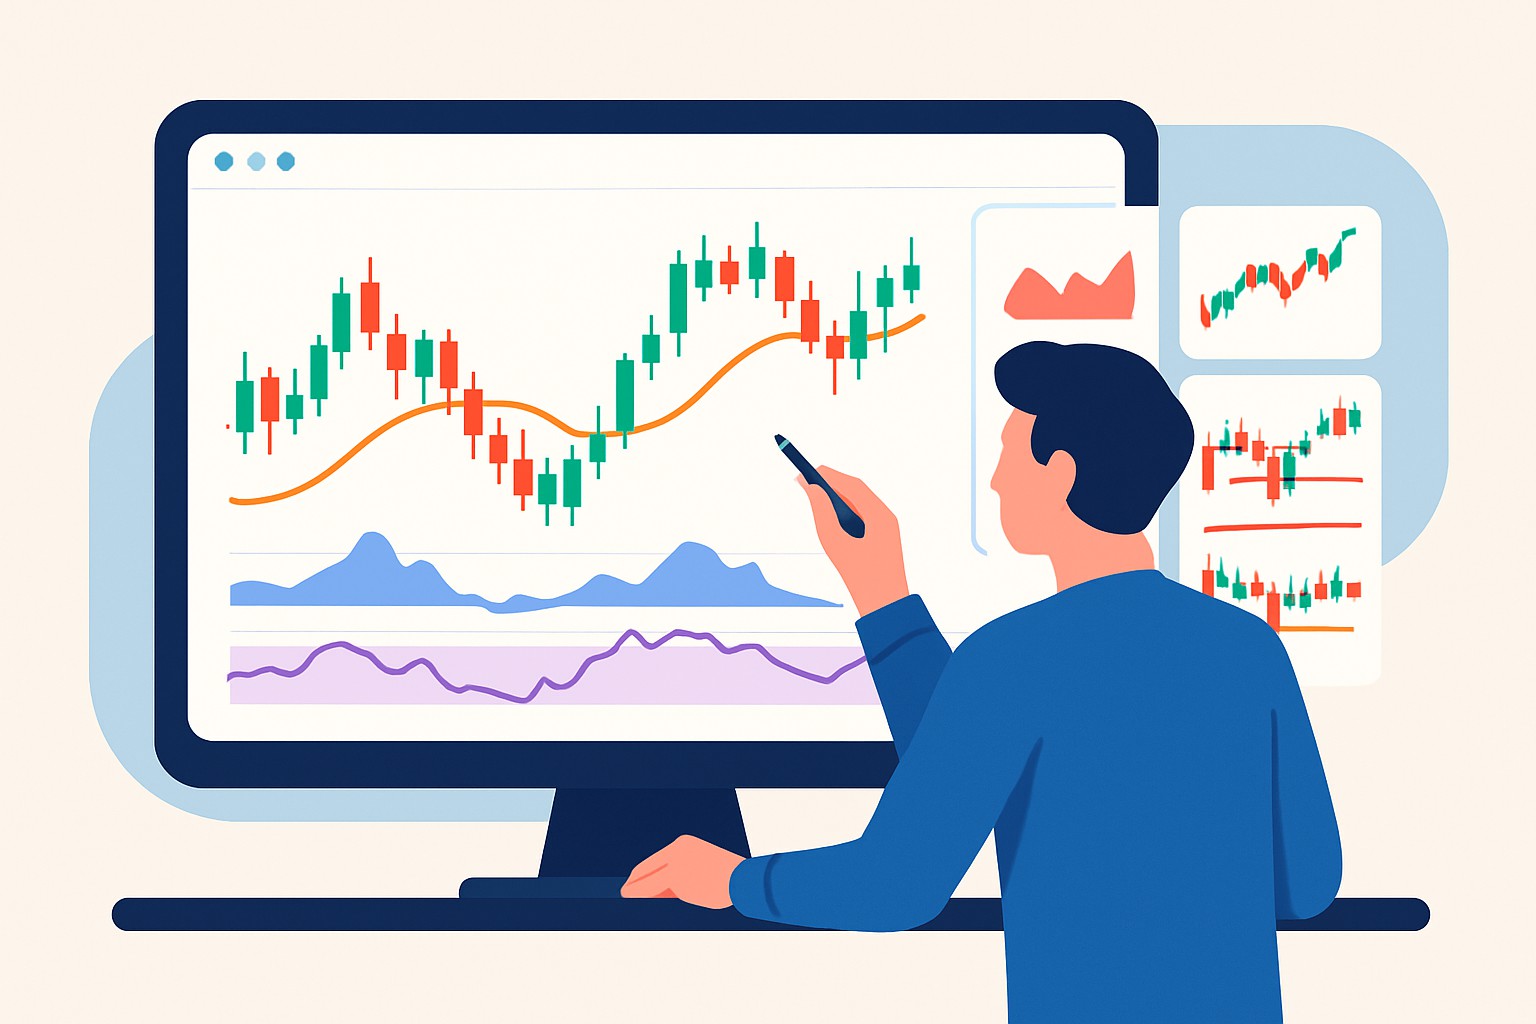
Master the art of risk control in momentum trading. Discover step-by-step strategies to safeguard your capital and enhance your trading success.

Liquidity is the ease of buying or selling assets at stable prices. Discover why liquidity matters in trading and how it impacts your market success.
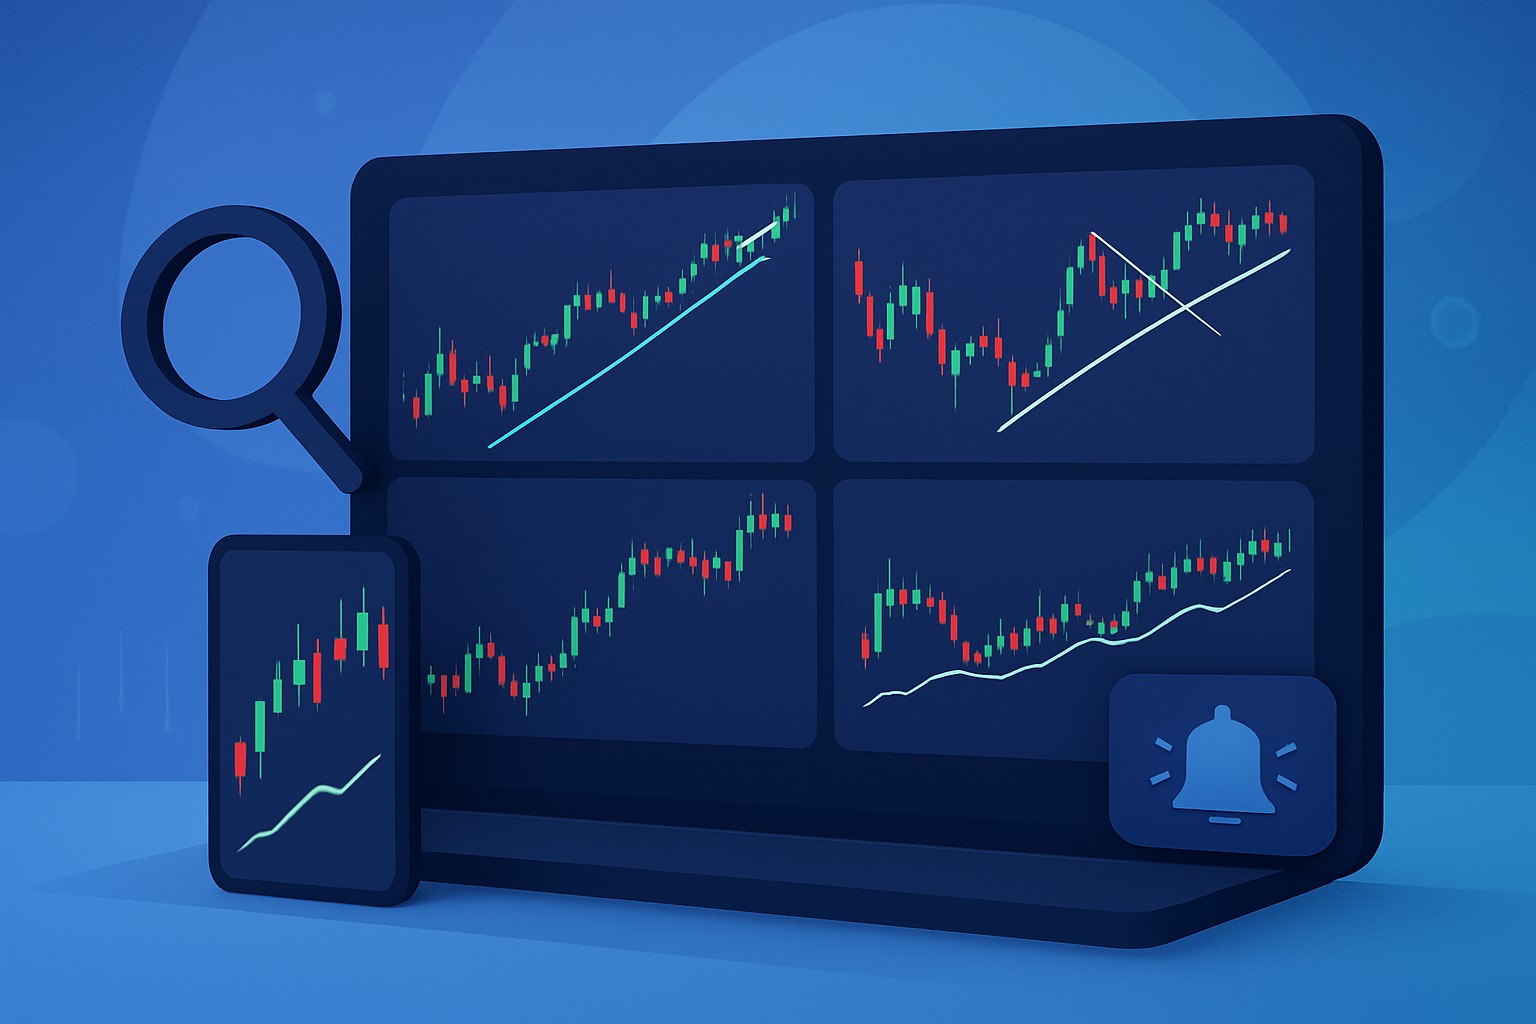
Unlock smarter trading by mastering the TrendSpider Scanner. This guide walks you through setting up scans, advanced techniques, and integrating alerts for better trade decisions.
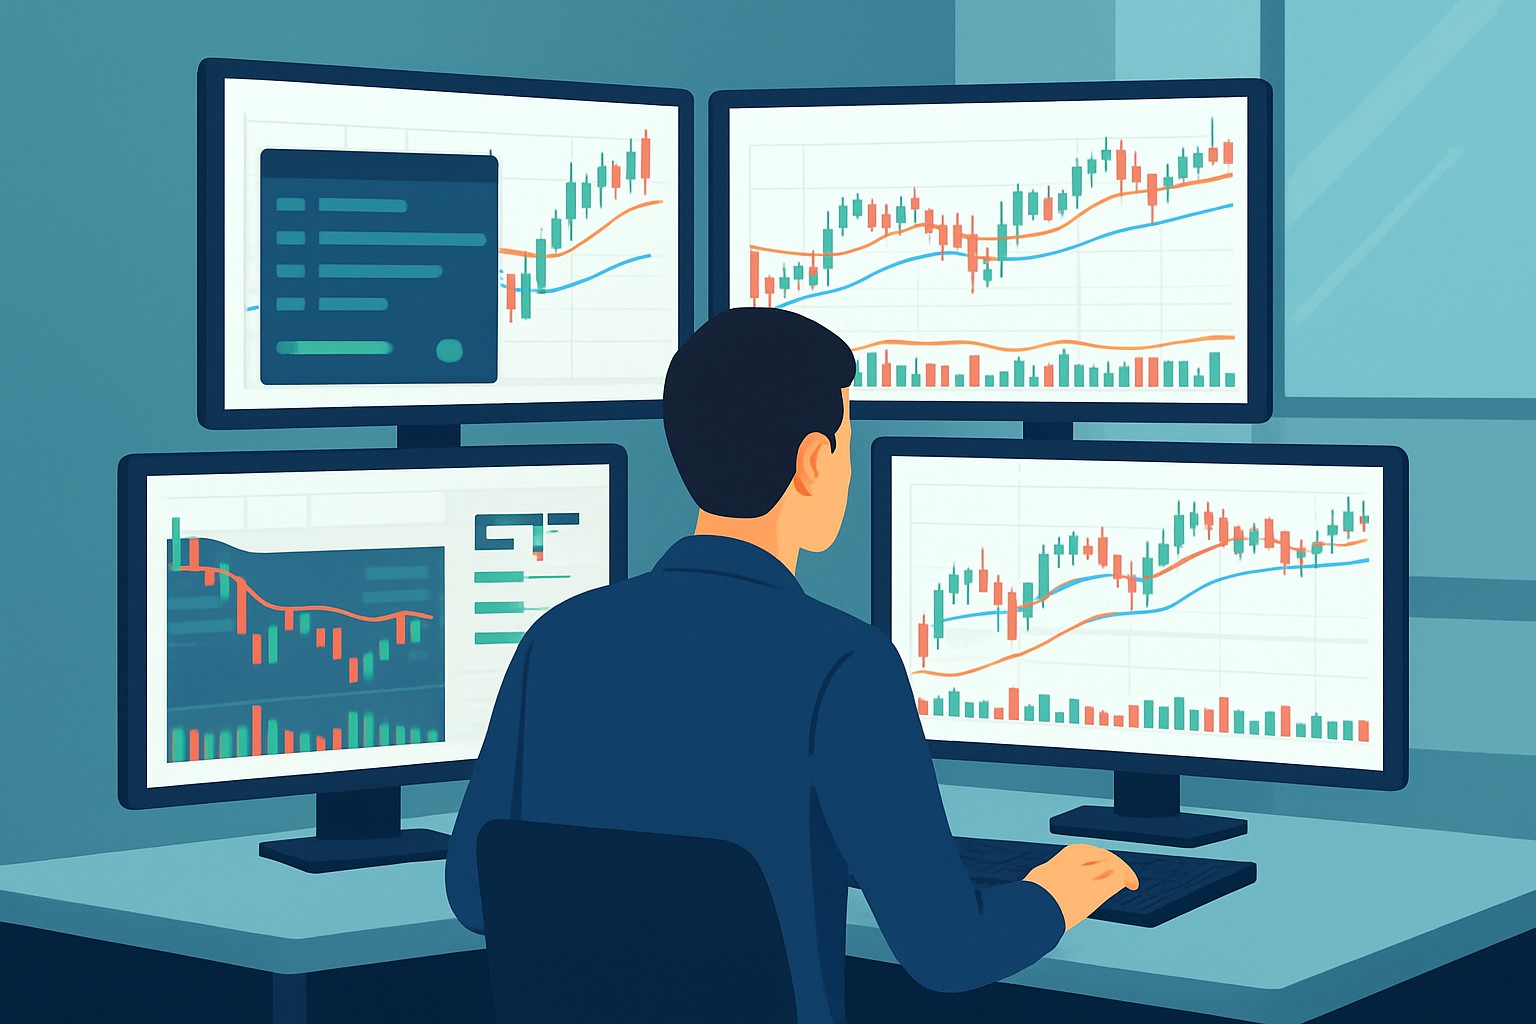
Dive into our comprehensive analysis of TrendSpider vs Trade Ideas, two powerful trading platforms, to discover how their features and pricing cater to different trader needs.
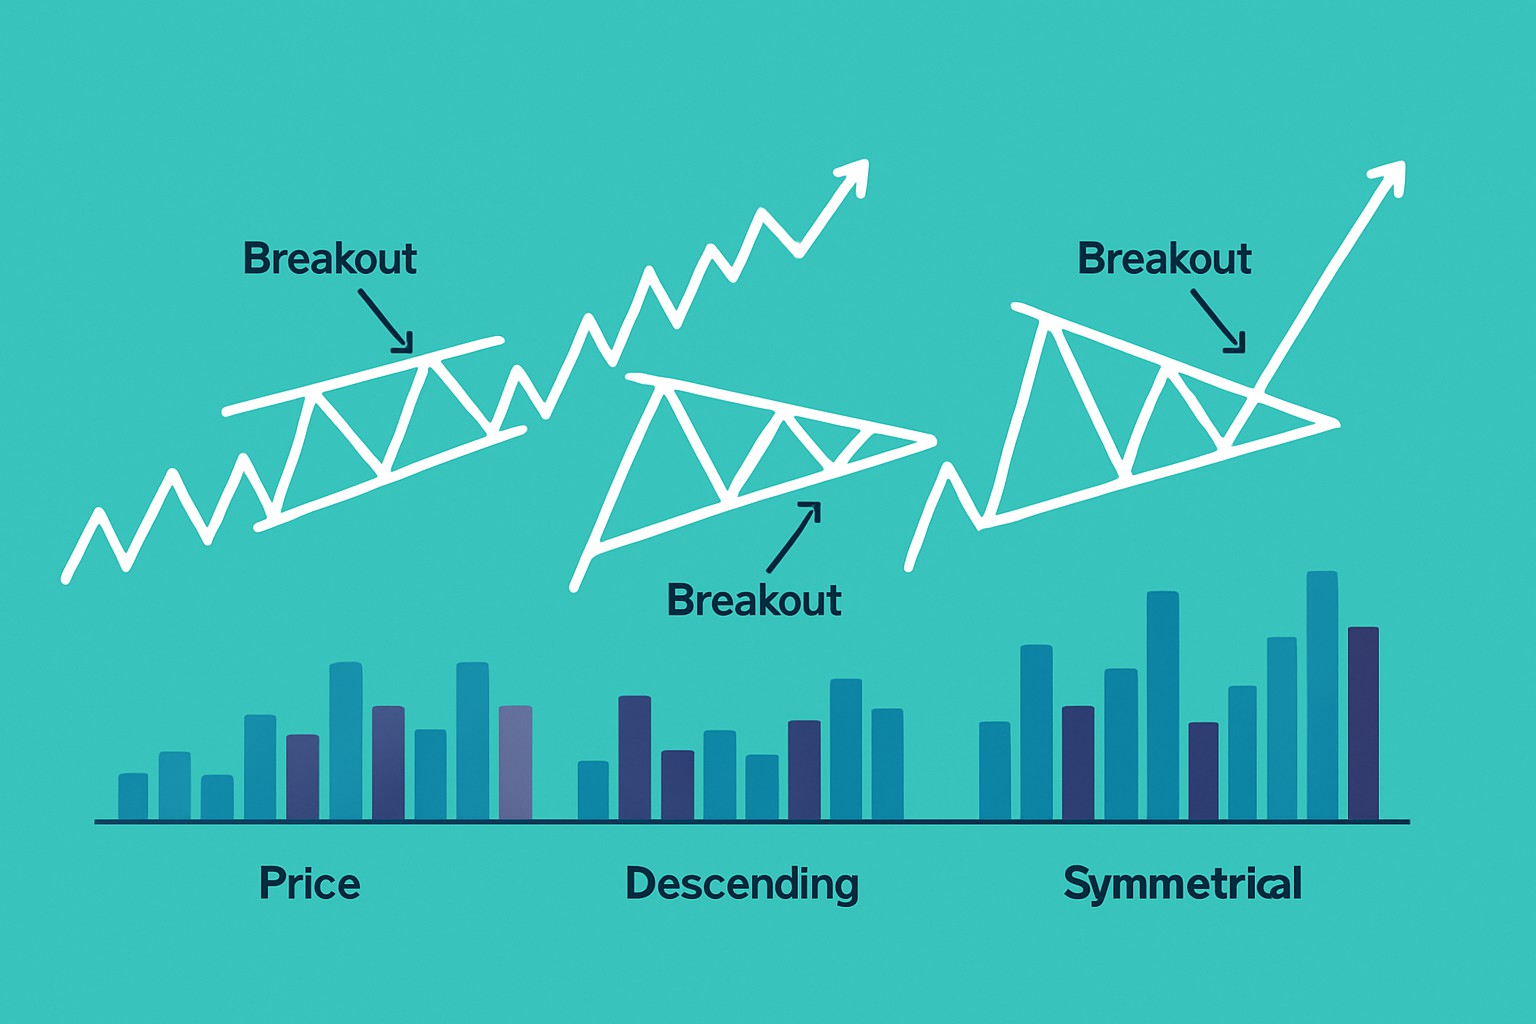
Discover how pattern triangles help traders predict price movements. This guide breaks down triangle types, identification methods, and breakout analysis for better trading decisions.

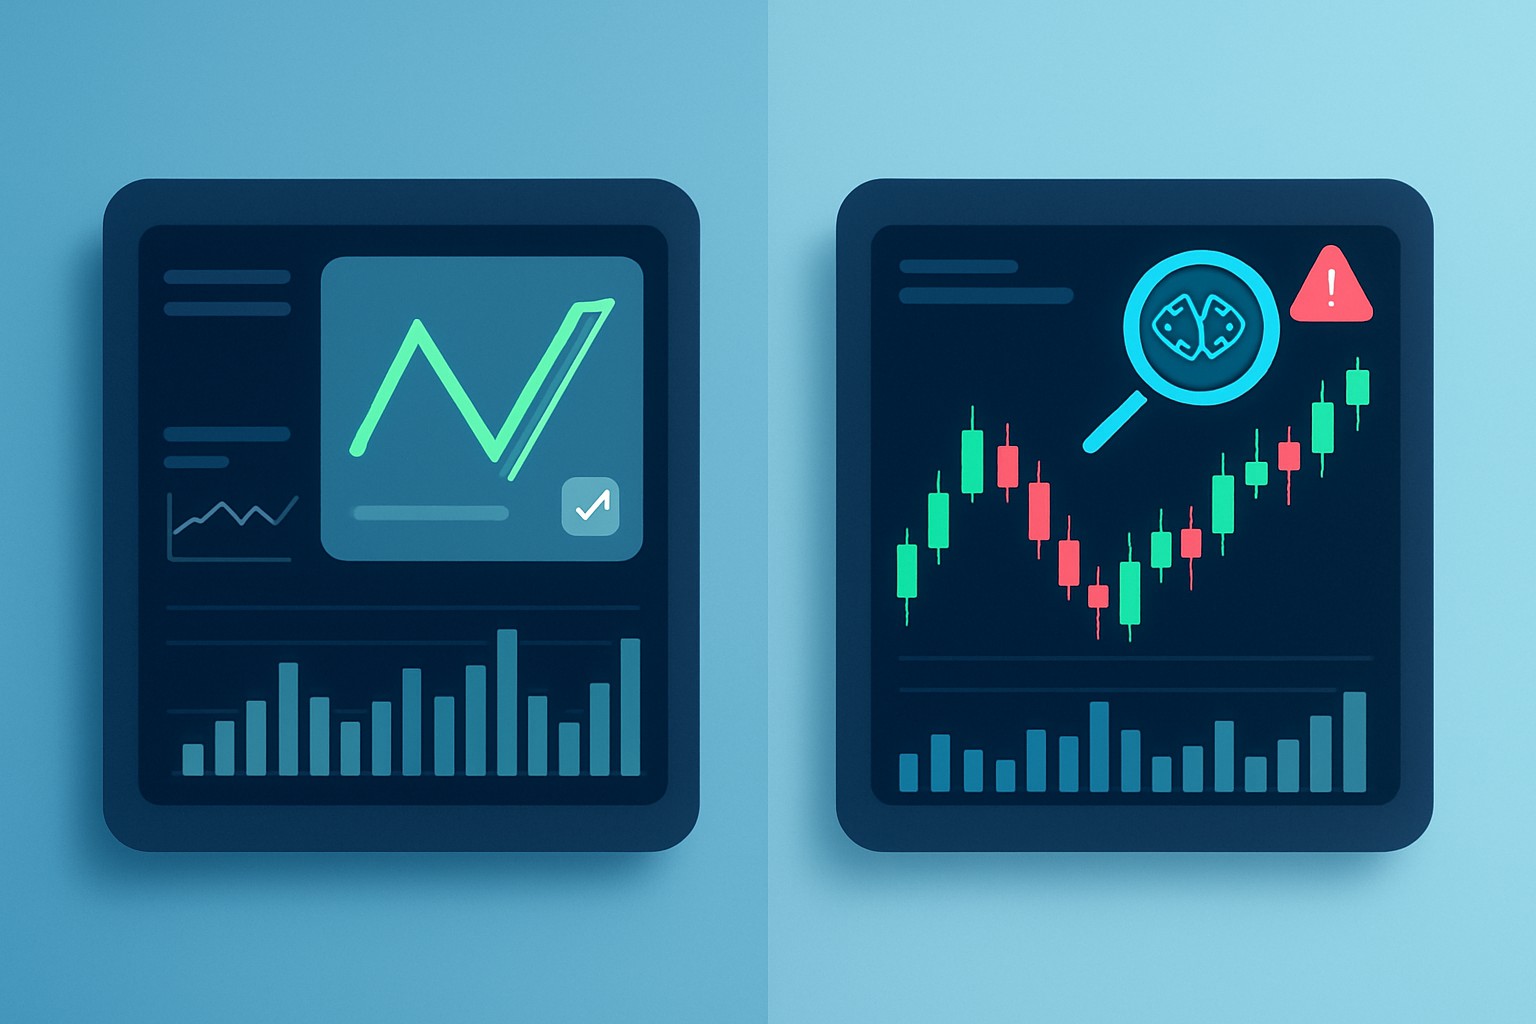
TrendSpider AI revolutionizes chart analysis by automating trendline detection and pattern recognition — helping traders make smarter, faster decisions with less effort.
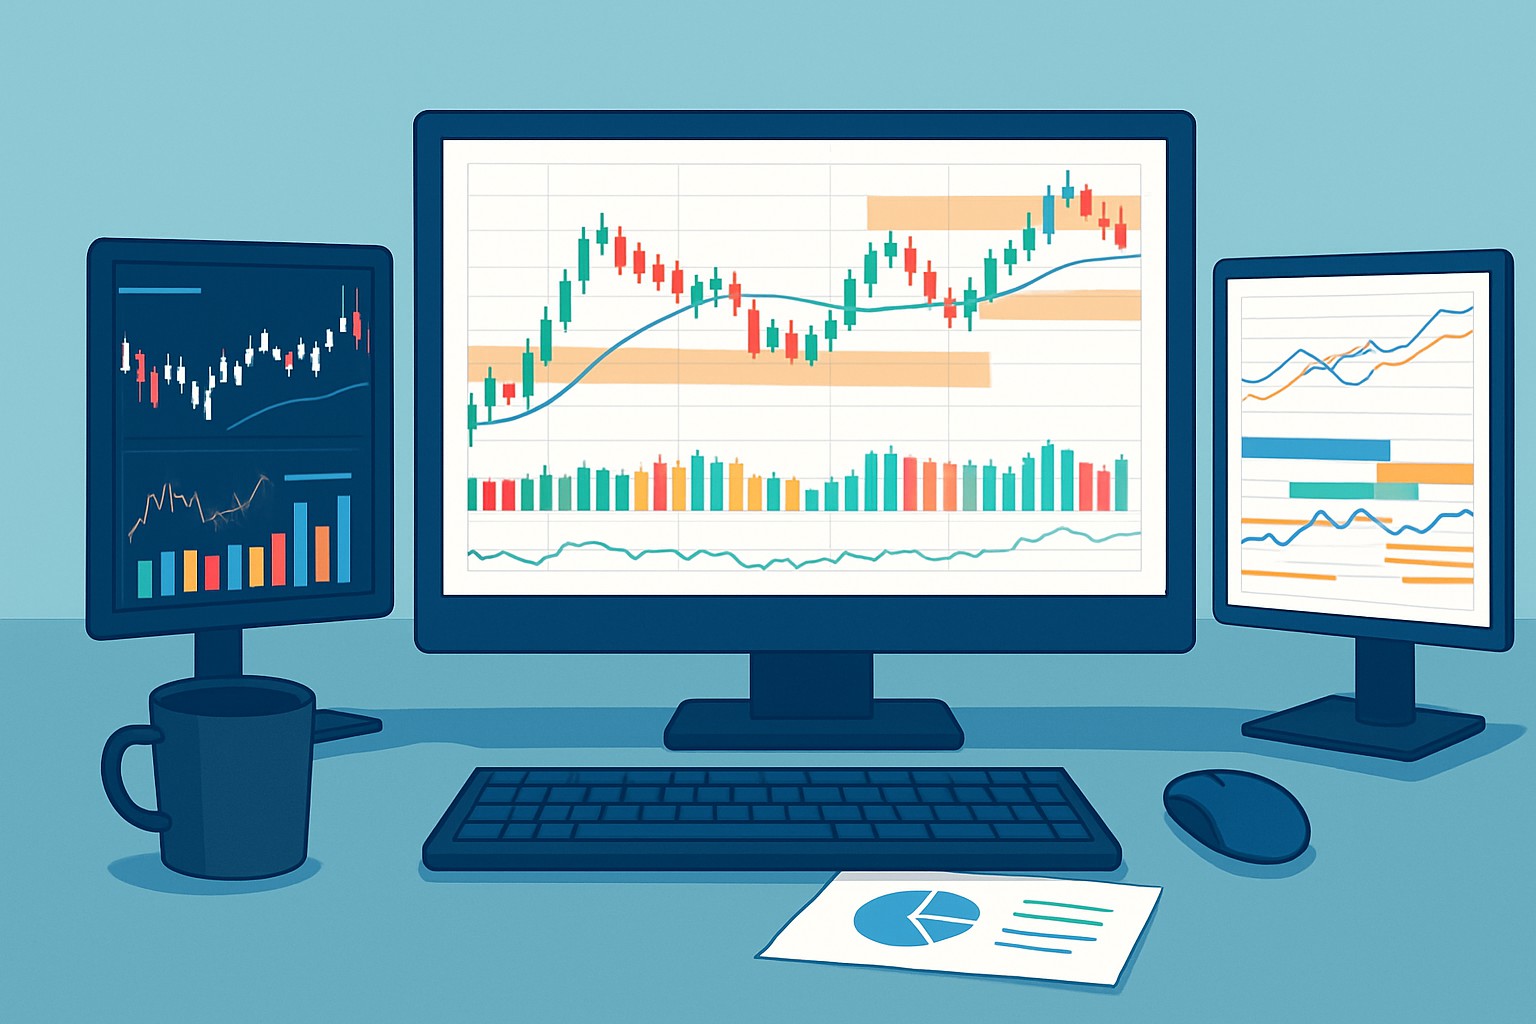
Discover proven day trading strategies using TradingView charts. This guide equips you with practical steps to analyze markets, execute trades, and manage risk confidently.

Oil inventory reports are key to understanding energy markets. This article breaks down how inventory data works and why it influences oil prices globally.
Discover what ICT trading is and how it differs from other strategies. Learn to decode institutional market signals and gain an edge in your trading approach.
Unlock the power of TrendSpider charts with advanced AI tools, automated alerts, and customizable indicators to revolutionize your trading strategies.
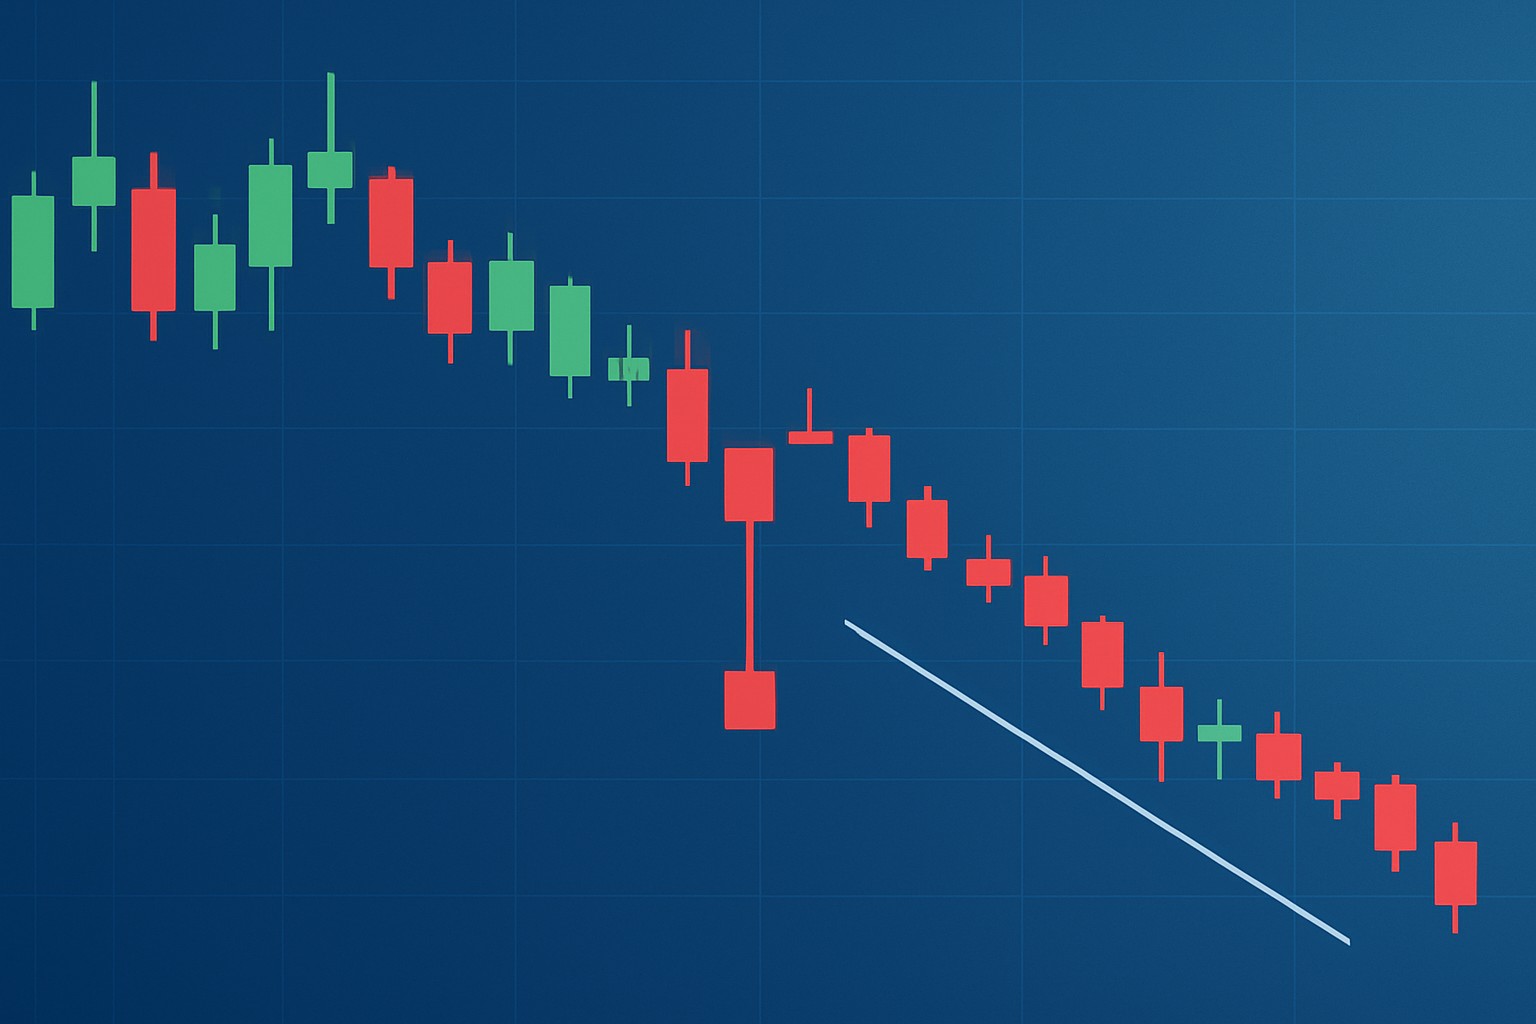
Discover how the bearish hammer candlestick pattern signals potential market reversals. This guide breaks down its key features, psychology, and how to spot it confidently on charts.
Unlock the power of TrendSpider indicators with this comprehensive guide, mastering advanced tools for smarter technical analysis and optimized trading strategies.

