IAO Alliance
  • Trade Insights
    • Technical Analysis
    • Financial Analysis
  • Trading Strategies
    • Swing Trading
    • Short-Term Trading
    • Algorithmic Trade Execution
  • Toolkit
    • Charting Software
    • Trade Execution
    • Backtests
    • Data Advantage
  • Markets
    • Foreign Exchange
    • Options Strategies
    • Futures Trading
    • Stocks
  • Risk Management
    • Position Sizing
    • Stop Losses
  • Knowledge Base
    • Trading Terminology
    • Tutorials
  • Products
    • TradingView
    • TrendSpider
  • Brokerages
Trade Insights Technical Analysis

Technical Analysis

37 articles

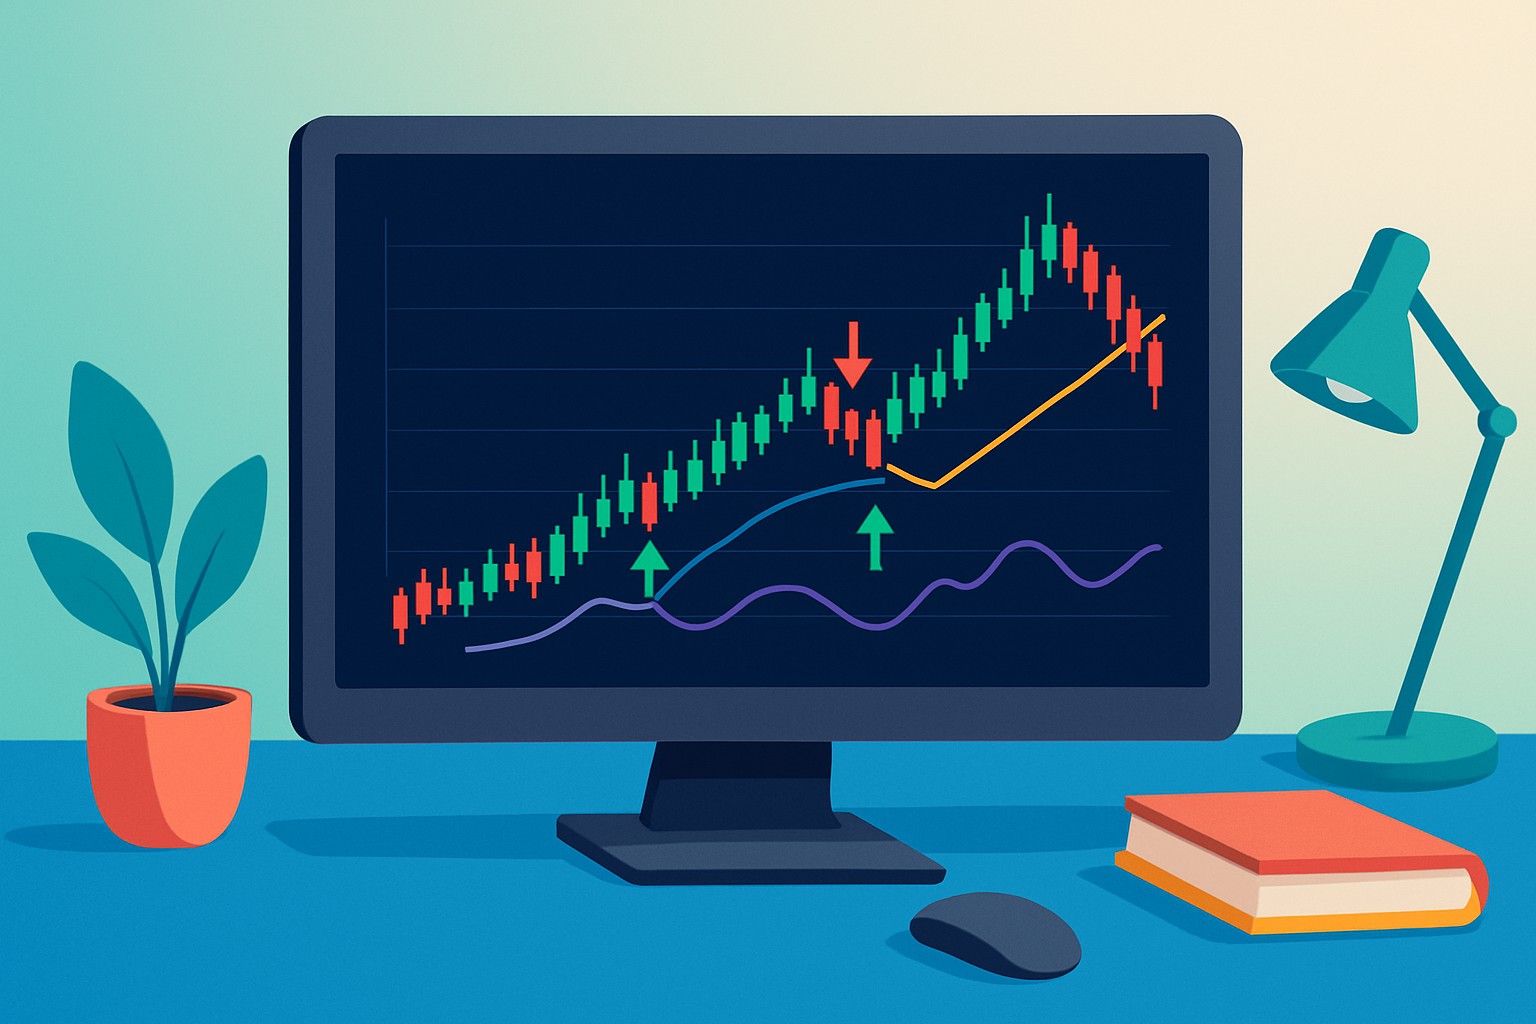
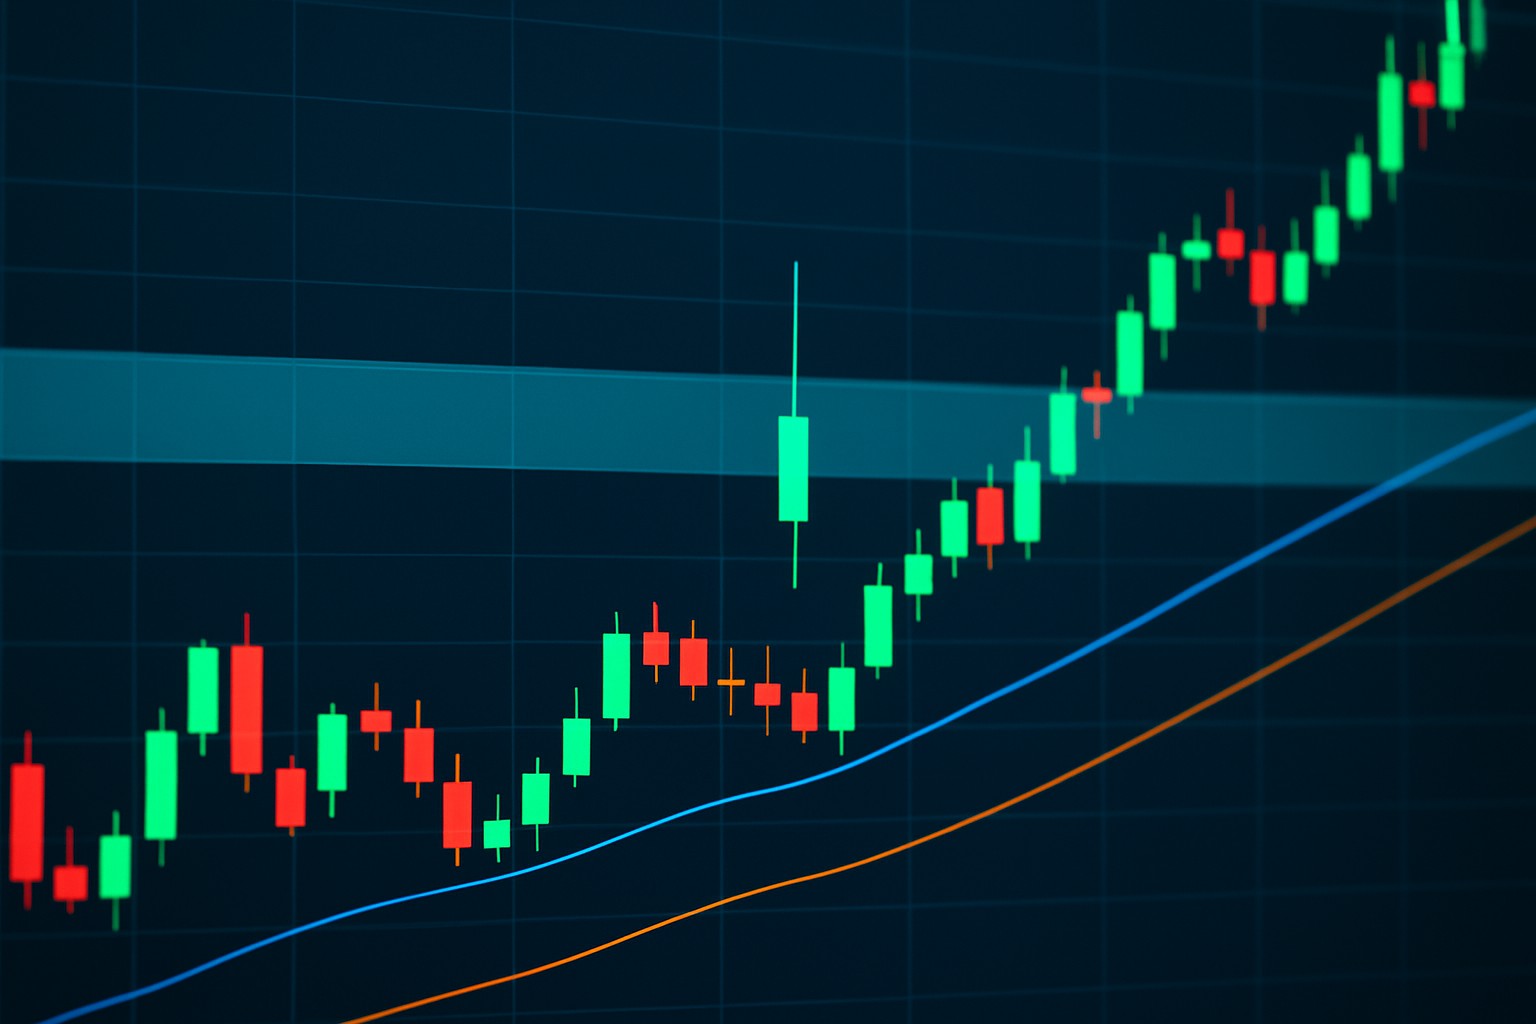
Utilize chart patterns, indicators, and price action to identify trends and entry/exit points.

Double Bottom Chart Pattern And What Traders Should Watch

Double Bottom Chart Pattern And What Traders Should Watch

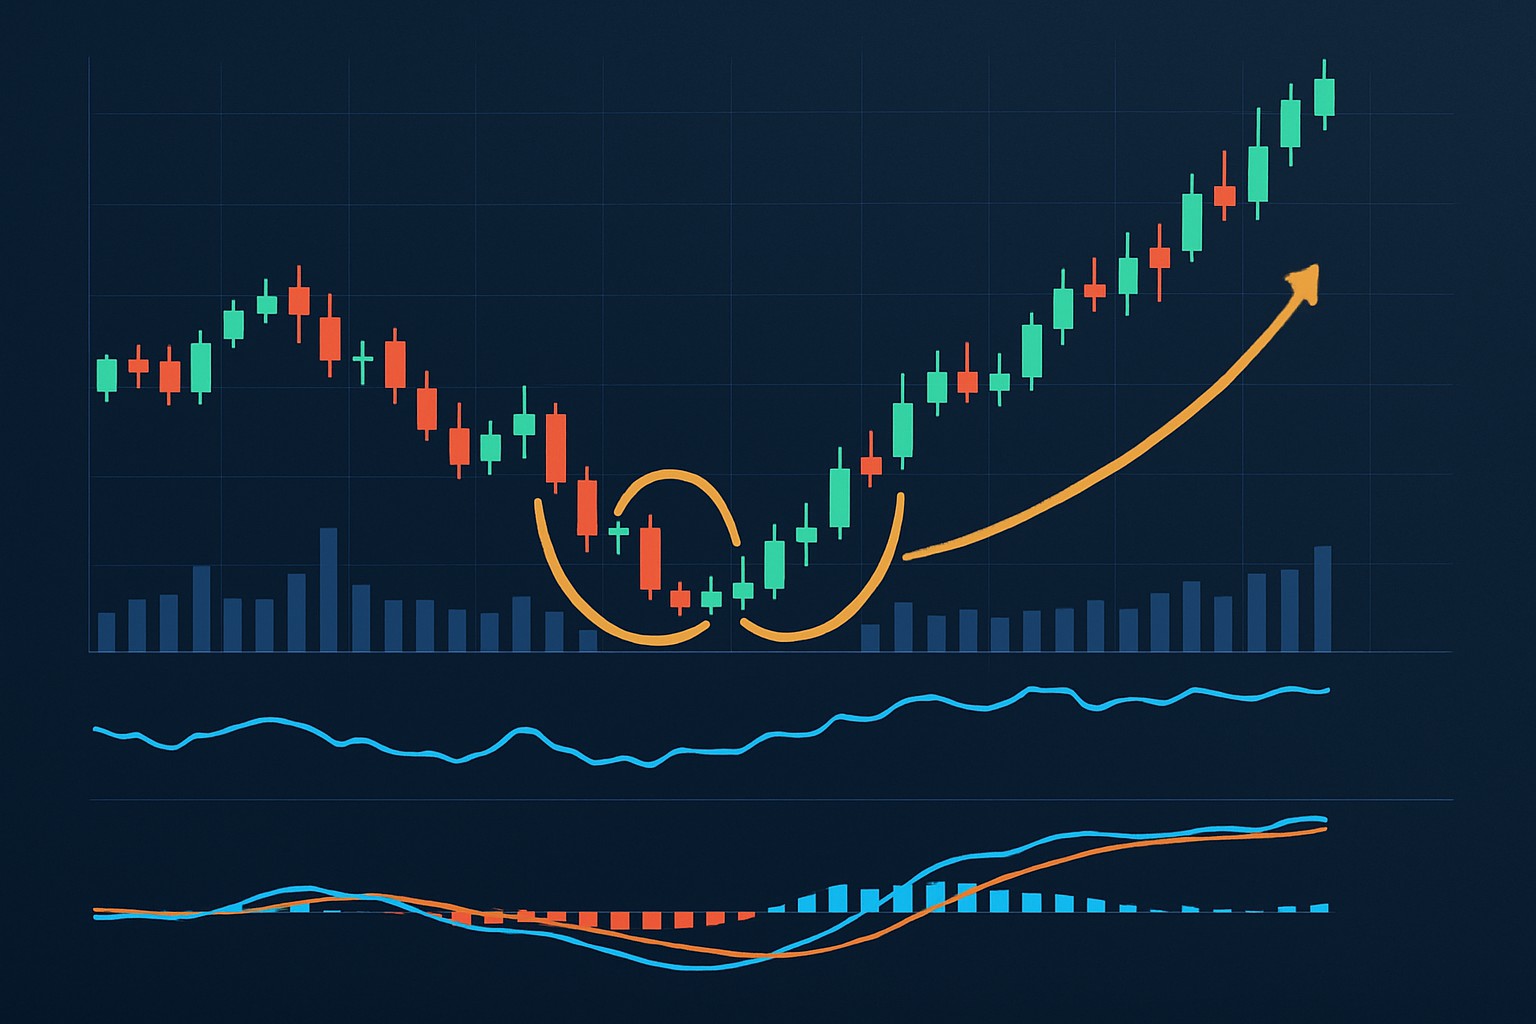
Discover how the double bottom chart pattern signals bullish reversals and how traders can spot, verify, and trade it confidently using key technical tools.

Jul 23, 2025 11 minutes read
Using Heikin-Ashi Candlesticks To Spot Trading Signals

Using Heikin-Ashi Candlesticks To Spot Trading Signals

Heikin-Ashi candlesticks simplify market noise to reveal clean trends and trading signals, empowering traders to make smarter decisions. Discover their calculation, interpretation, and practical use in your trading strategy.

Jul 22, 2025 12 minutes read
Average Directional Indicator To Spot When Trends Change

Average Directional Indicator To Spot When Trends Change

The Average Directional Indicator (ADX) is a powerful tool to measure trend strength and spot when market trends shift. This guide simplifies ADX concepts so anyone can use it confidently.

Jul 22, 2025 11 minutes read
How to Spot Reversals Using Spinning Top Candlestick Pattern

How to Spot Reversals Using Spinning Top Candlestick Pattern

Master the spinning top candlestick pattern to detect market indecision and potential reversals. This guide breaks down the pattern's basics, signs, and trading strategies for all skill levels.

Jul 17, 2025 8 minutes read
Candlestick Reversal Patterns To Spot Trend Changes

Candlestick Reversal Patterns To Spot Trend Changes

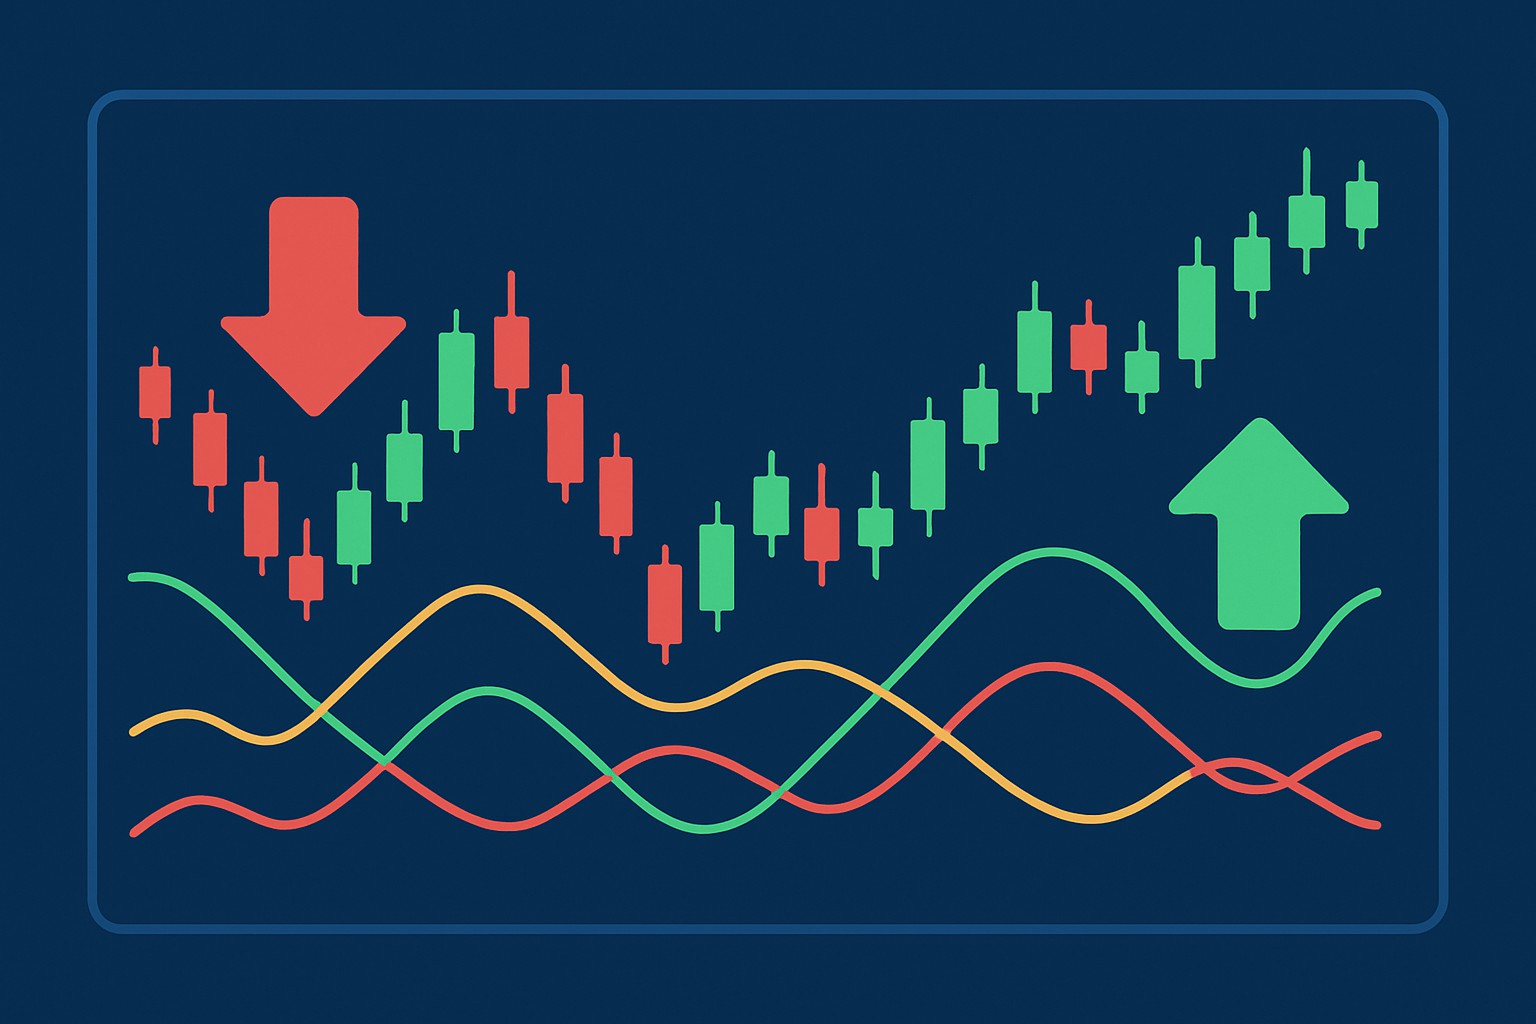
Candlestick reversal patterns offer essential clues about potential market trend shifts. This article breaks down key patterns in simple terms, helping you spot and utilize them in your trading strategy.

Jul 17, 2025 12 minutes read
Common Forex Patterns Every Trader Should Recognize

Common Forex Patterns Every Trader Should Recognize

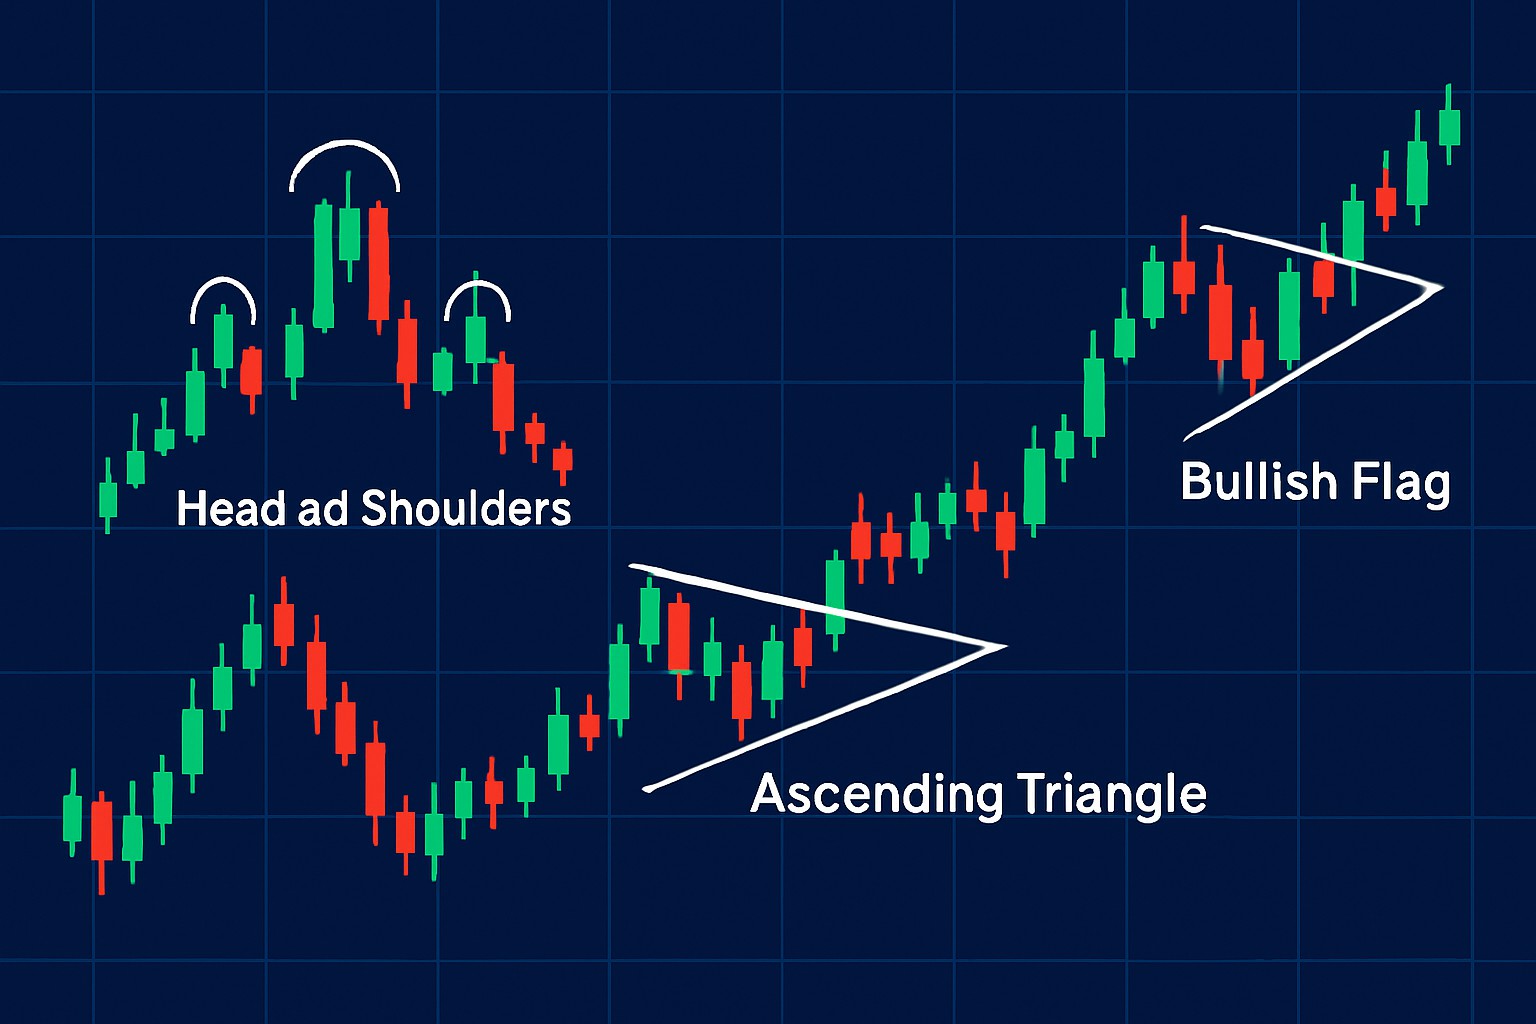
Master the art of forex trading by recognizing common price patterns that reveal potential trend changes and continuations. This guide breaks down essential forex patterns in simple terms to boost your trading confidence.

Jul 13, 2025 12 minutes read
Spotting Triangle Patterns in Charts

Spotting Triangle Patterns in Charts

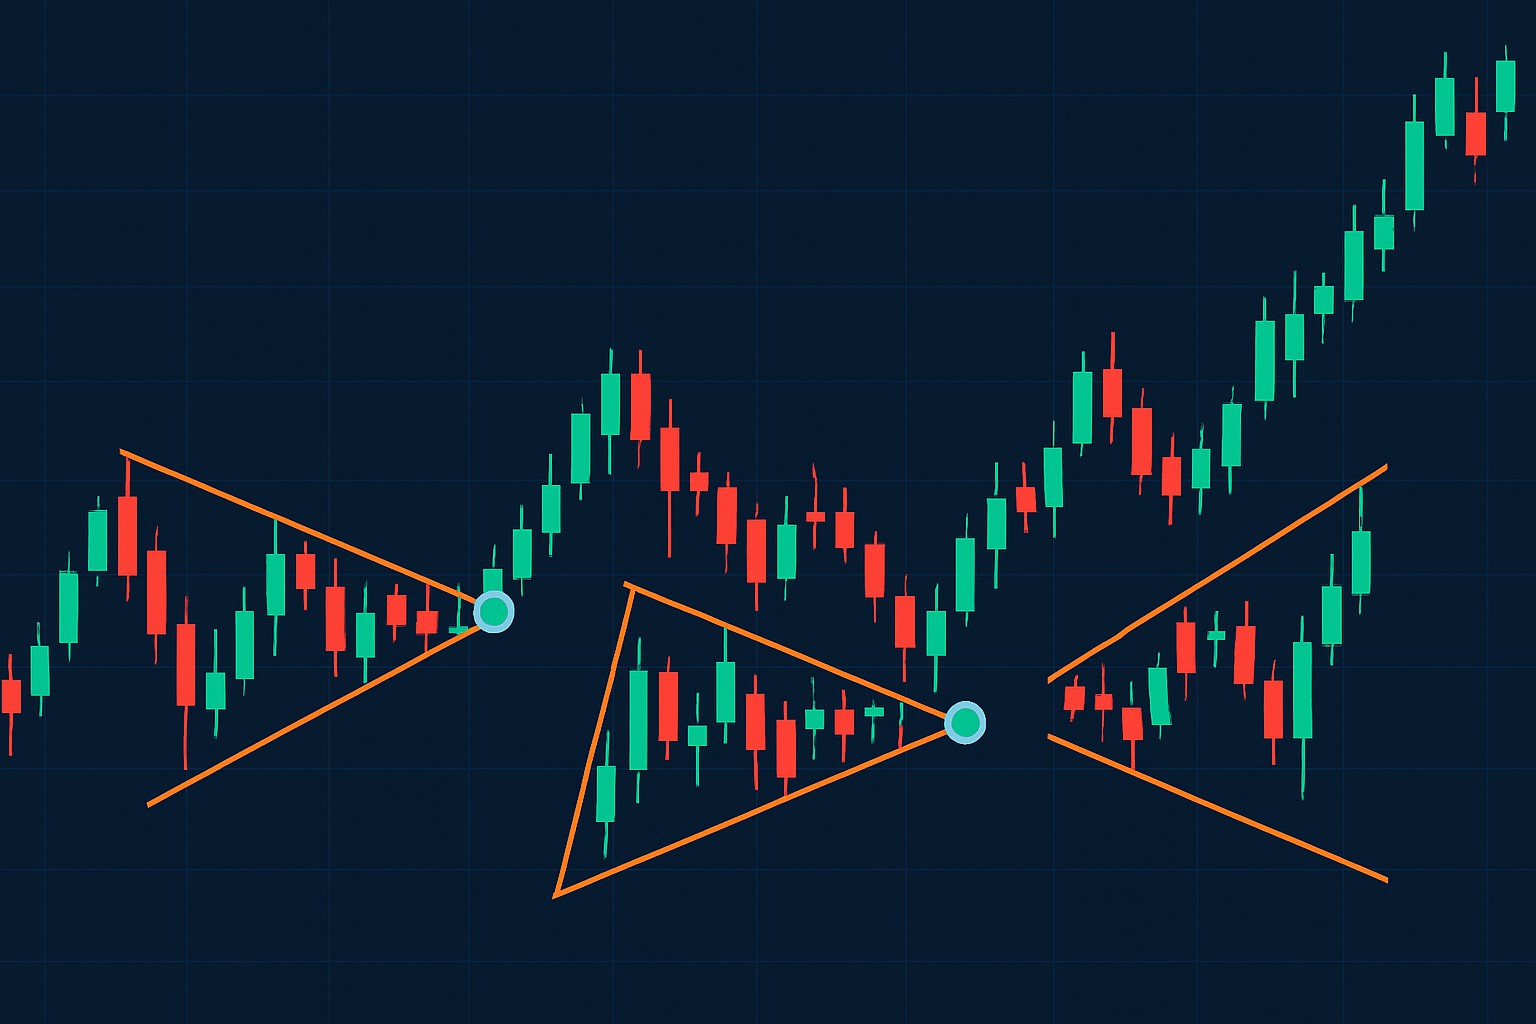
Unlock the power of triangle patterns in charts with our comprehensive guide, revealing how to identify, confirm, and trade these key formations across markets.

Jul 12, 2025 20 minutes read
Understanding Hammer And Inverted Hammer Candles For Trading

Understanding Hammer And Inverted Hammer Candles For Trading

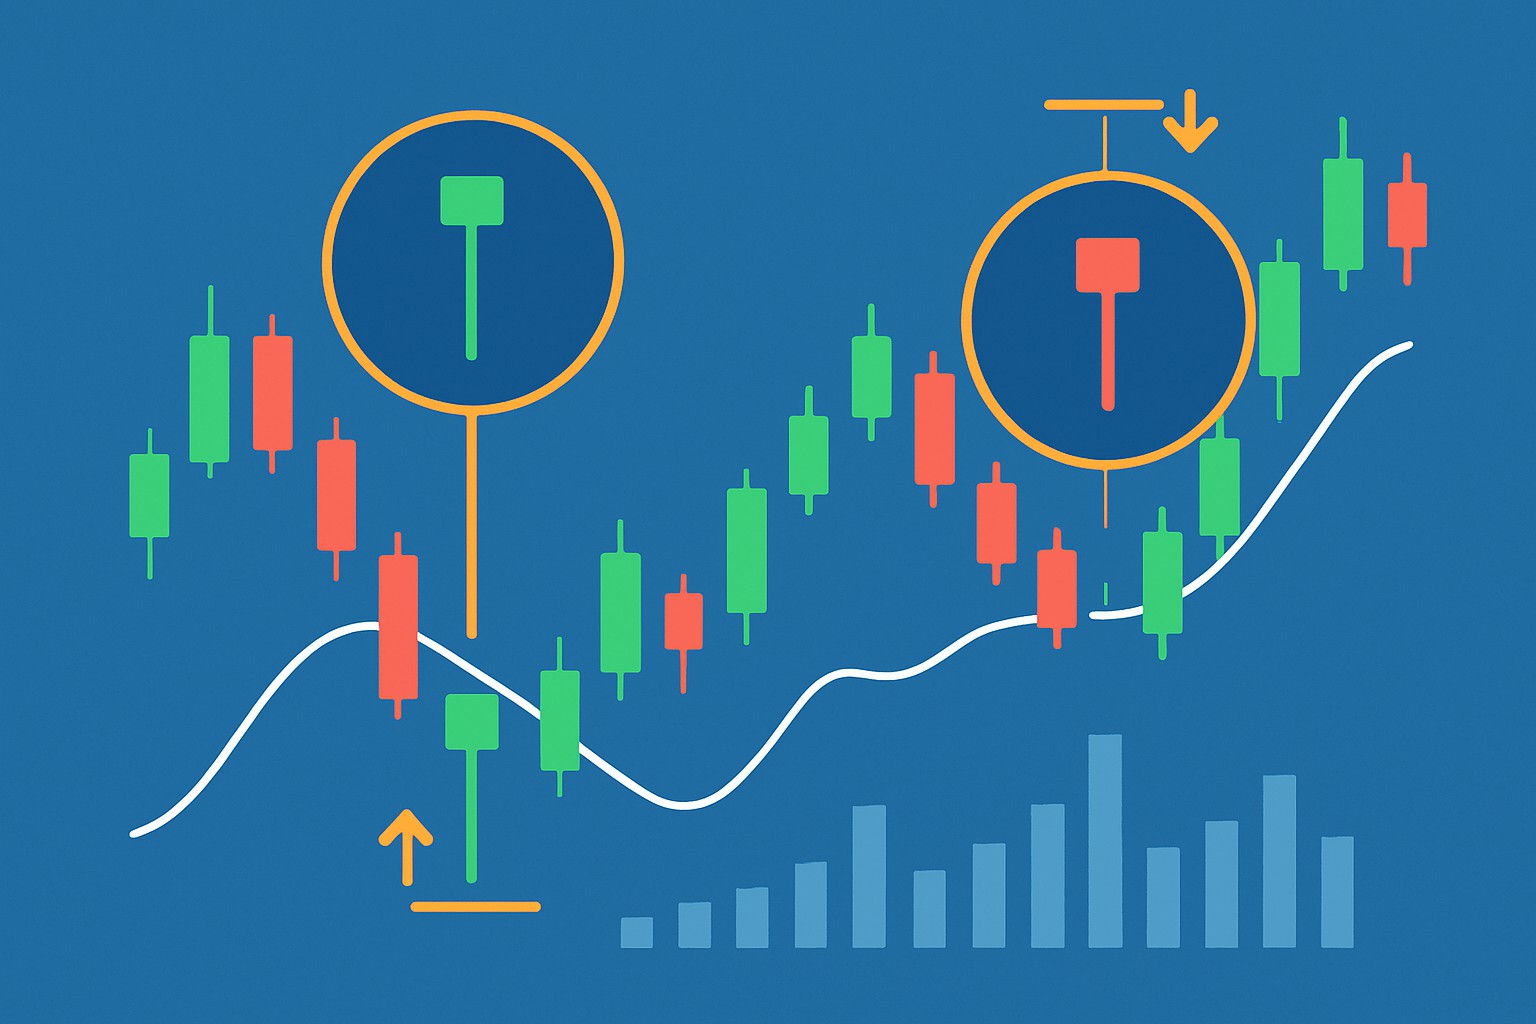
Discover how hammer and inverted hammer candlesticks can help traders spot market reversals. This guide explains their shapes, meanings, and strategic uses for all experience levels.

Jul 12, 2025 10 minutes read
Reading Heikenashi Candles To Understand Trend Strength

Reading Heikenashi Candles To Understand Trend Strength

Discover the power of Heikenashi candles to smooth price data and reveal true trend strength. Learn how to interpret these unique charts and make smarter trading decisions.

Jul 02, 2025 8 minutes read
Spotting strong signals with engulfing candles

Spotting strong signals with engulfing candles

Engulfing candles are key indicators in technical analysis, revealing potential price reversals. This guide breaks down their patterns, criteria for strength, and practical trading applications for all skill levels.

Jul 02, 2025 7 minutes read
Order Block Trading Explained for New Traders

Order Block Trading Explained for New Traders

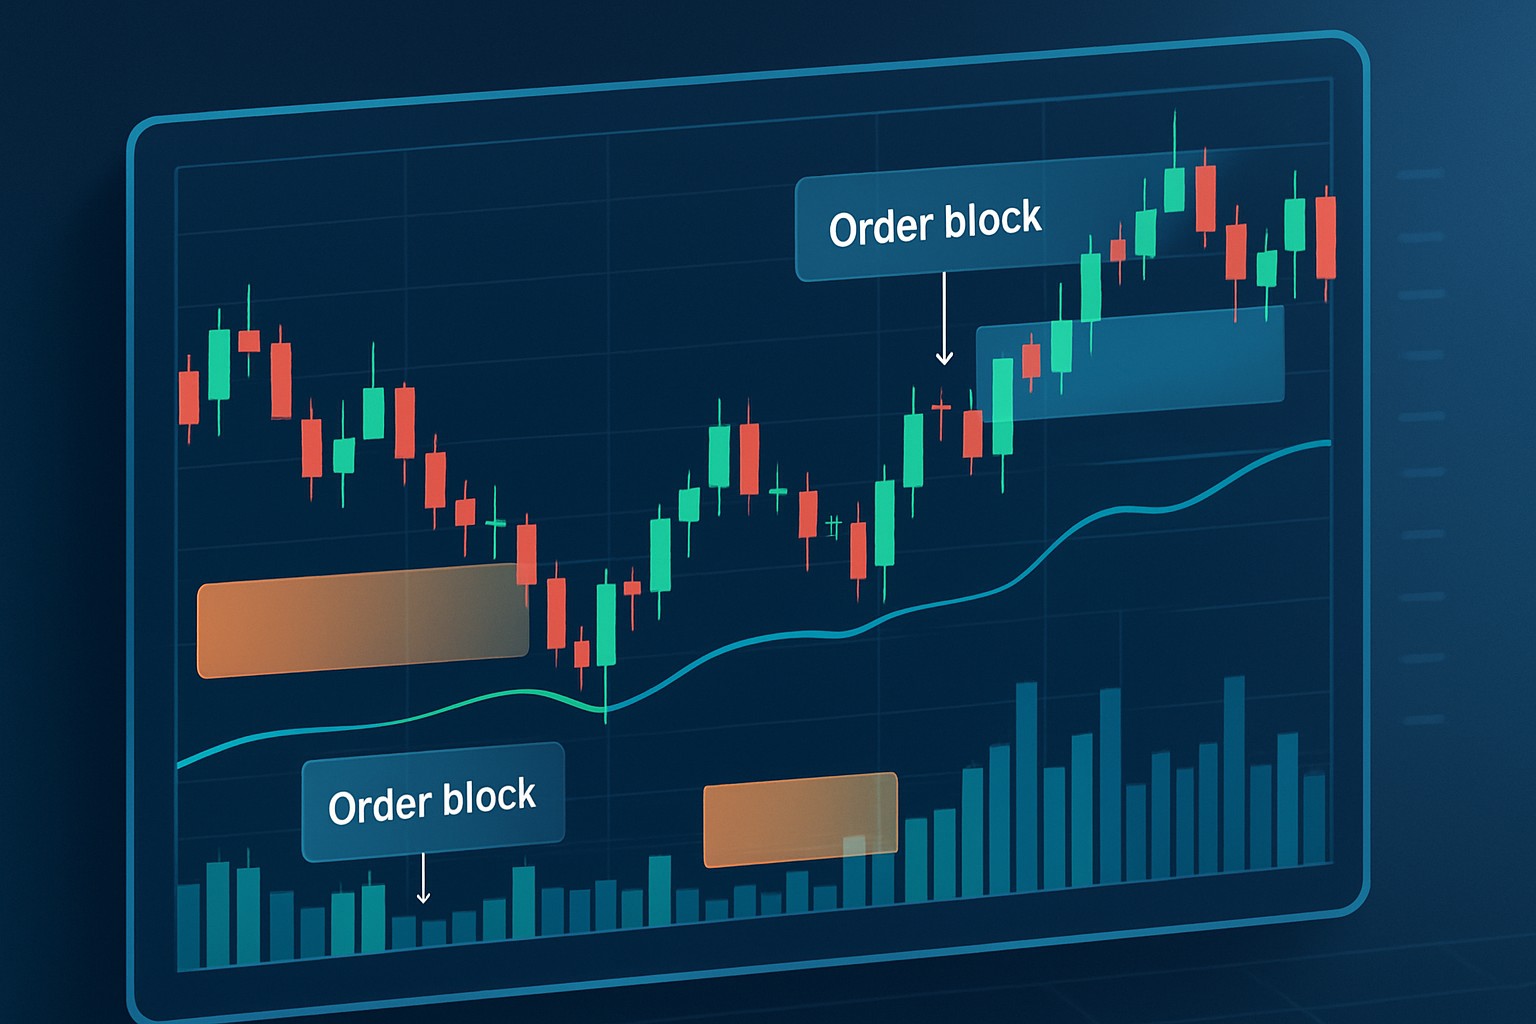
Order block trading reveals where big players enter markets, providing new traders with powerful clues for high-probability trades. Learn these essential concepts and strategies in plain language.

Jul 01, 2025 7 minutes read
How To Read Reverse Hammer Candles In Trading Charts

How To Read Reverse Hammer Candles In Trading Charts

Unlock the power of reverse hammer candles with this practical guide. Learn how to identify, interpret, and trade using reverse hammer candles to enhance your trading strategy.

Jun 30, 2025 9 minutes read
« Previous Next »

Showing 13 to 24 of 37 results

1 2 3 4
TrendSpider + IAO Alliance
Trendspider
Ad

Trending Now

How To Set Up Paper Trading in TradingView For Beginners
TradingView • 1 month ago
Best TradingView Indicators Traders Use To Spot Trends
TradingView • 1 month ago
Reading Heikenashi Candles To Understand Trend Strength
Technical Analysis • 1 month ago

Links

  • Contact Us

Trade Insights

  • Technical Analysis
  • Financial Analysis

Trading Strategies

  • Swing Trading
  • Short-Term Trading
  • Algorithmic Trade Execution

Toolkit

  • Charting Software
  • Trade Execution
  • Backtests
  • Data Advantage

Markets

  • Foreign Exchange
  • Options Strategies
  • Futures Trading
  • Stocks
IAO Alliance © 2025
[email protected]